
|
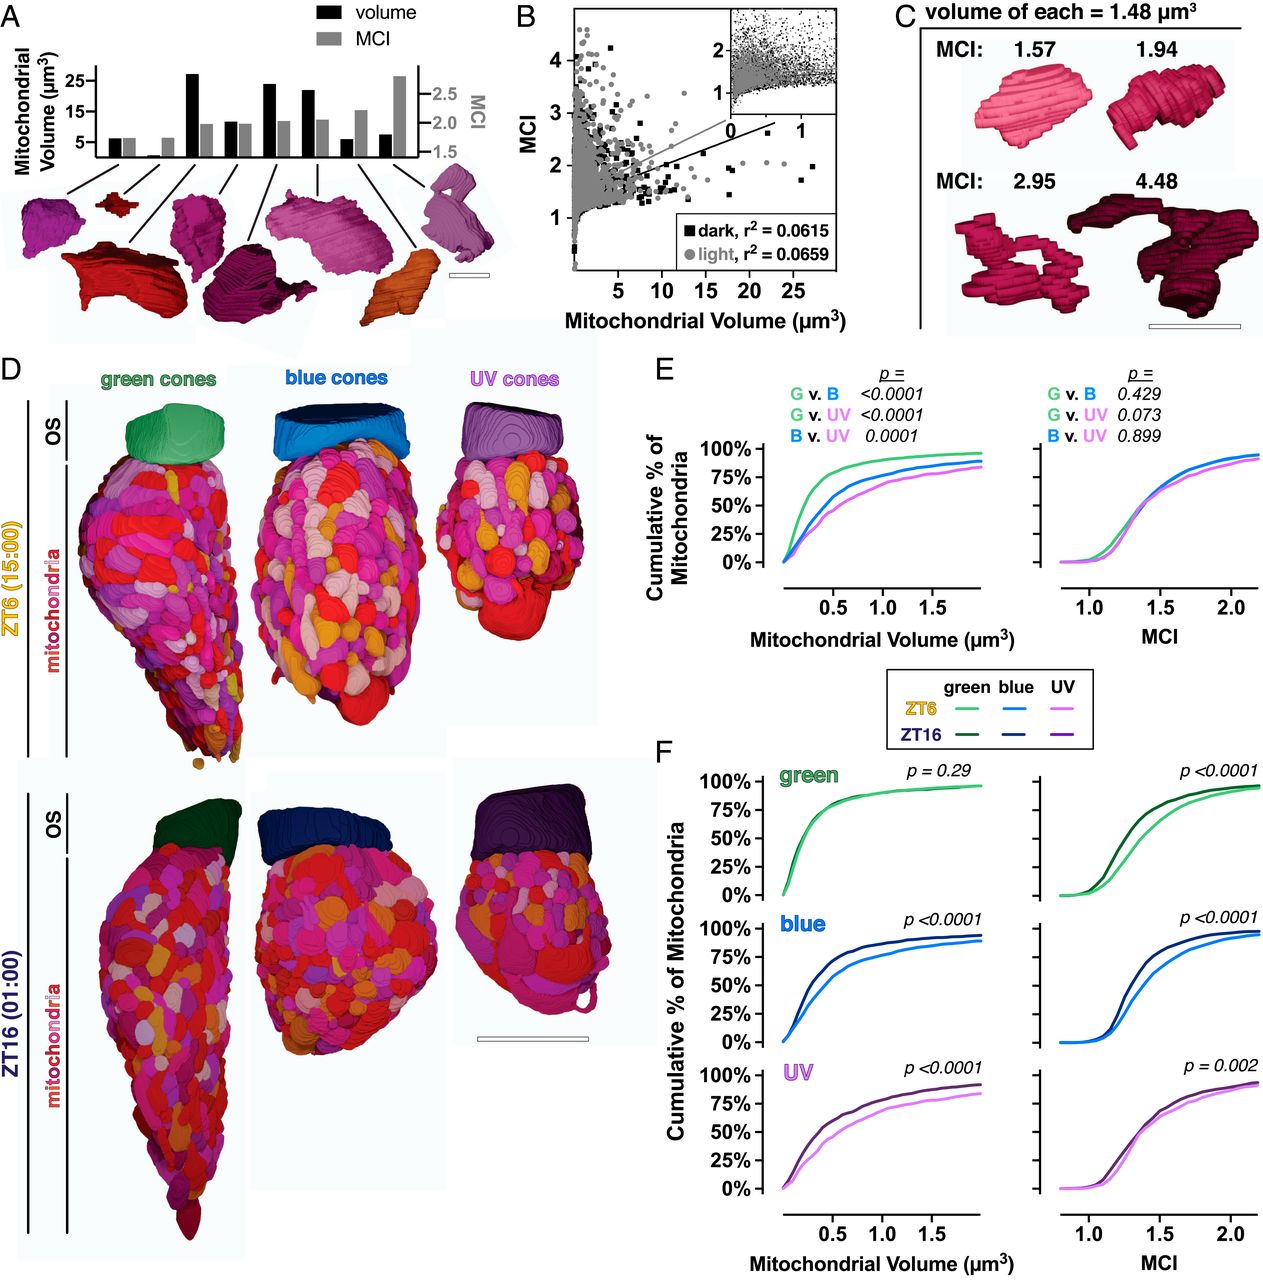
Fig. 2 At night cones have more simple mitochondria. (A) Three-dimensional renderings of eight manually segmented cone mitochondria with corresponding quantifications of volume (Left axis, black bars) and MCI (Right axis, gray bars). (Scale bar, 2 µm.) (B) Cross-correlation plot of mitochondrial volume and MCI for individual mitochondria at ZT16 (black squares) and ZT6 (gray circles). (C) Three-dimensional renderings of single mitochondria with equal volumes (1.48 µm3) over a range of MCIs. (Scale bar, 2 µm.) (D) Three-dimensional renderings from manual segmentation of mitochondria and OSs in green, blue, and UV cones at ZT6 and ZT16. (Scale bar, 5 µm.) (E) Cumulative frequency distributions for mitochondrial volume and MCI comparing mitochondria between cone subtypes at ZT6. (F) Cumulative frequency distributions for cone subtypes, comparing mitochondrial volume and MCI at ZT6 (light lines) and ZT16 (dark lines). ZT6 curves are also presented in E; SI Appendix, Table S2 lists Ns from all groups.