
|
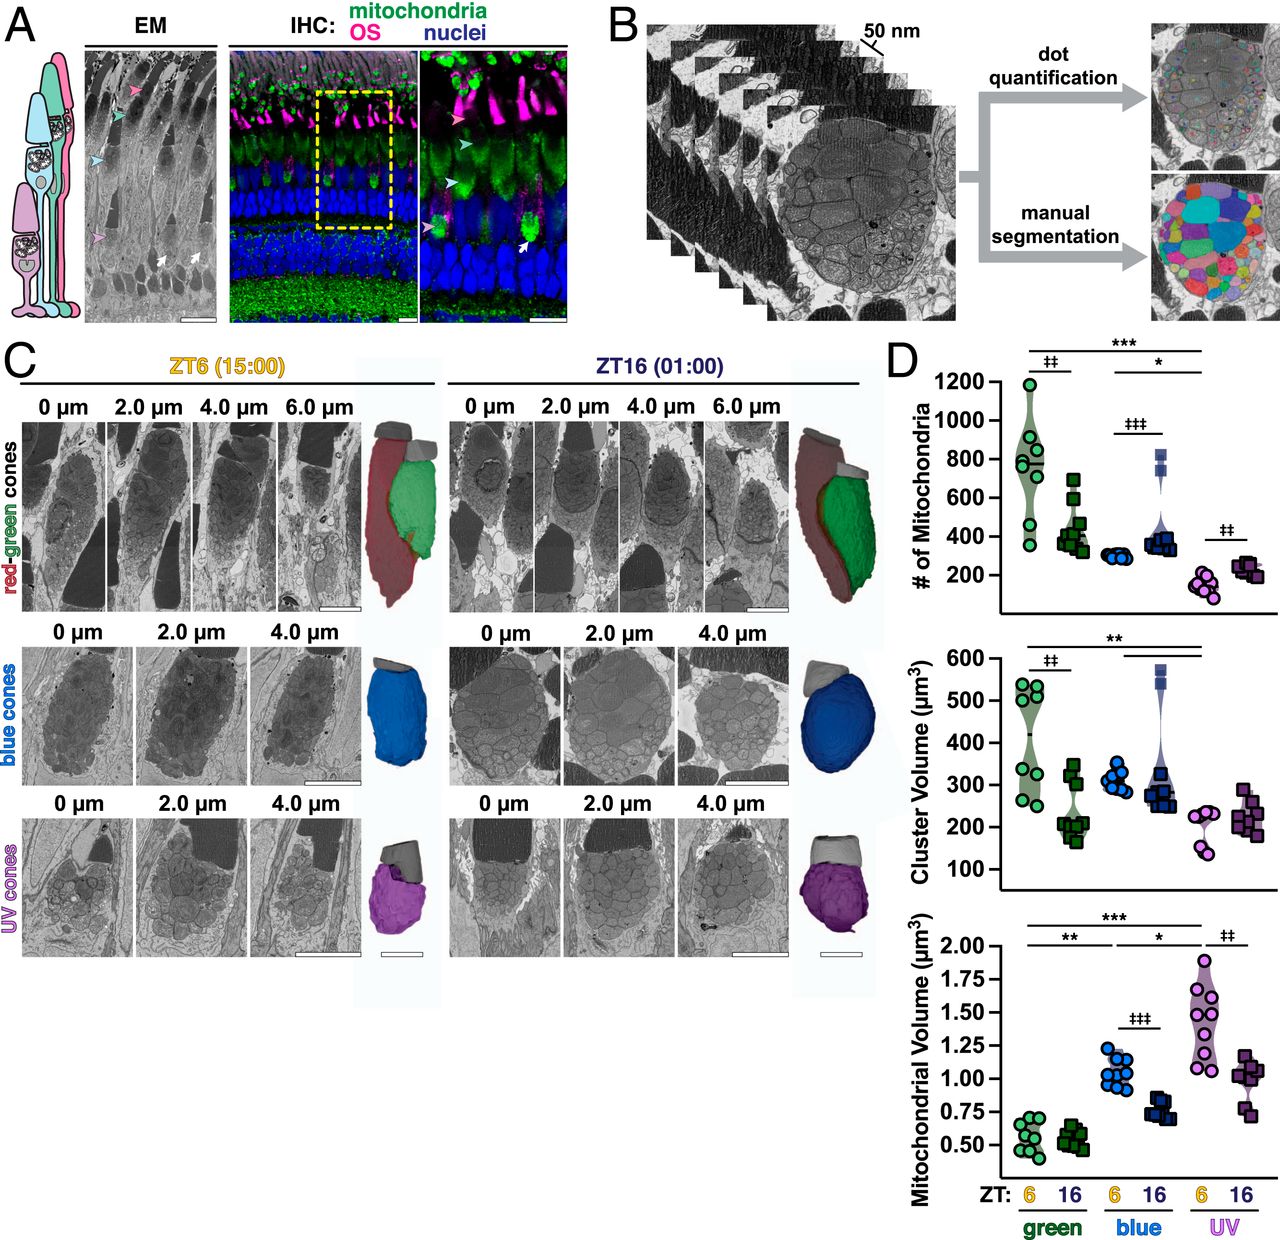
Fig. 1 At night single cones have more small mitochondria. (A) Schematic of zebrafish cone subtypes (Left), with EM (Middle) and IHC (Right) images of zebrafish outer retina. IHC images are stained for all mitochondria (green), red-green cone OSs (magenta), and nuclei (blue). Arrowheads indicate corresponding UV, blue, green, and red cone mitochondrial clusters; white arrows, megamitochondria at UV cluster bases. Yellow box, zoomed-in area. (Scale bars, 10 µm.) (B) Example 50-nm Z-stack from SBFSEM used for 3D analysis via manual segmentation or rapid dot quantification. (C) Z-stacks from SBFSEM with 3D-rendered mitochondrial clusters (colored) and OSs (gray) from green, blue, and UV cone subtypes in daytime at ZT6 (15:00) and night at ZT16 (01:00). (Scale bars, 5 µm.) (D) Violin plots of mitochondrial number, cluster volume, and mitochondrial volume from dot quantification and manual segmentation; lines represent median. Cone subtypes are represented by respective colors at ZT6 (circles) and ZT16 (squares). *,‡P < 0.05. **, ‡‡P < 0.01. ***,‡‡‡P < 0.001. SI Appendix, Table S2 lists statistical information and Ns from each group.