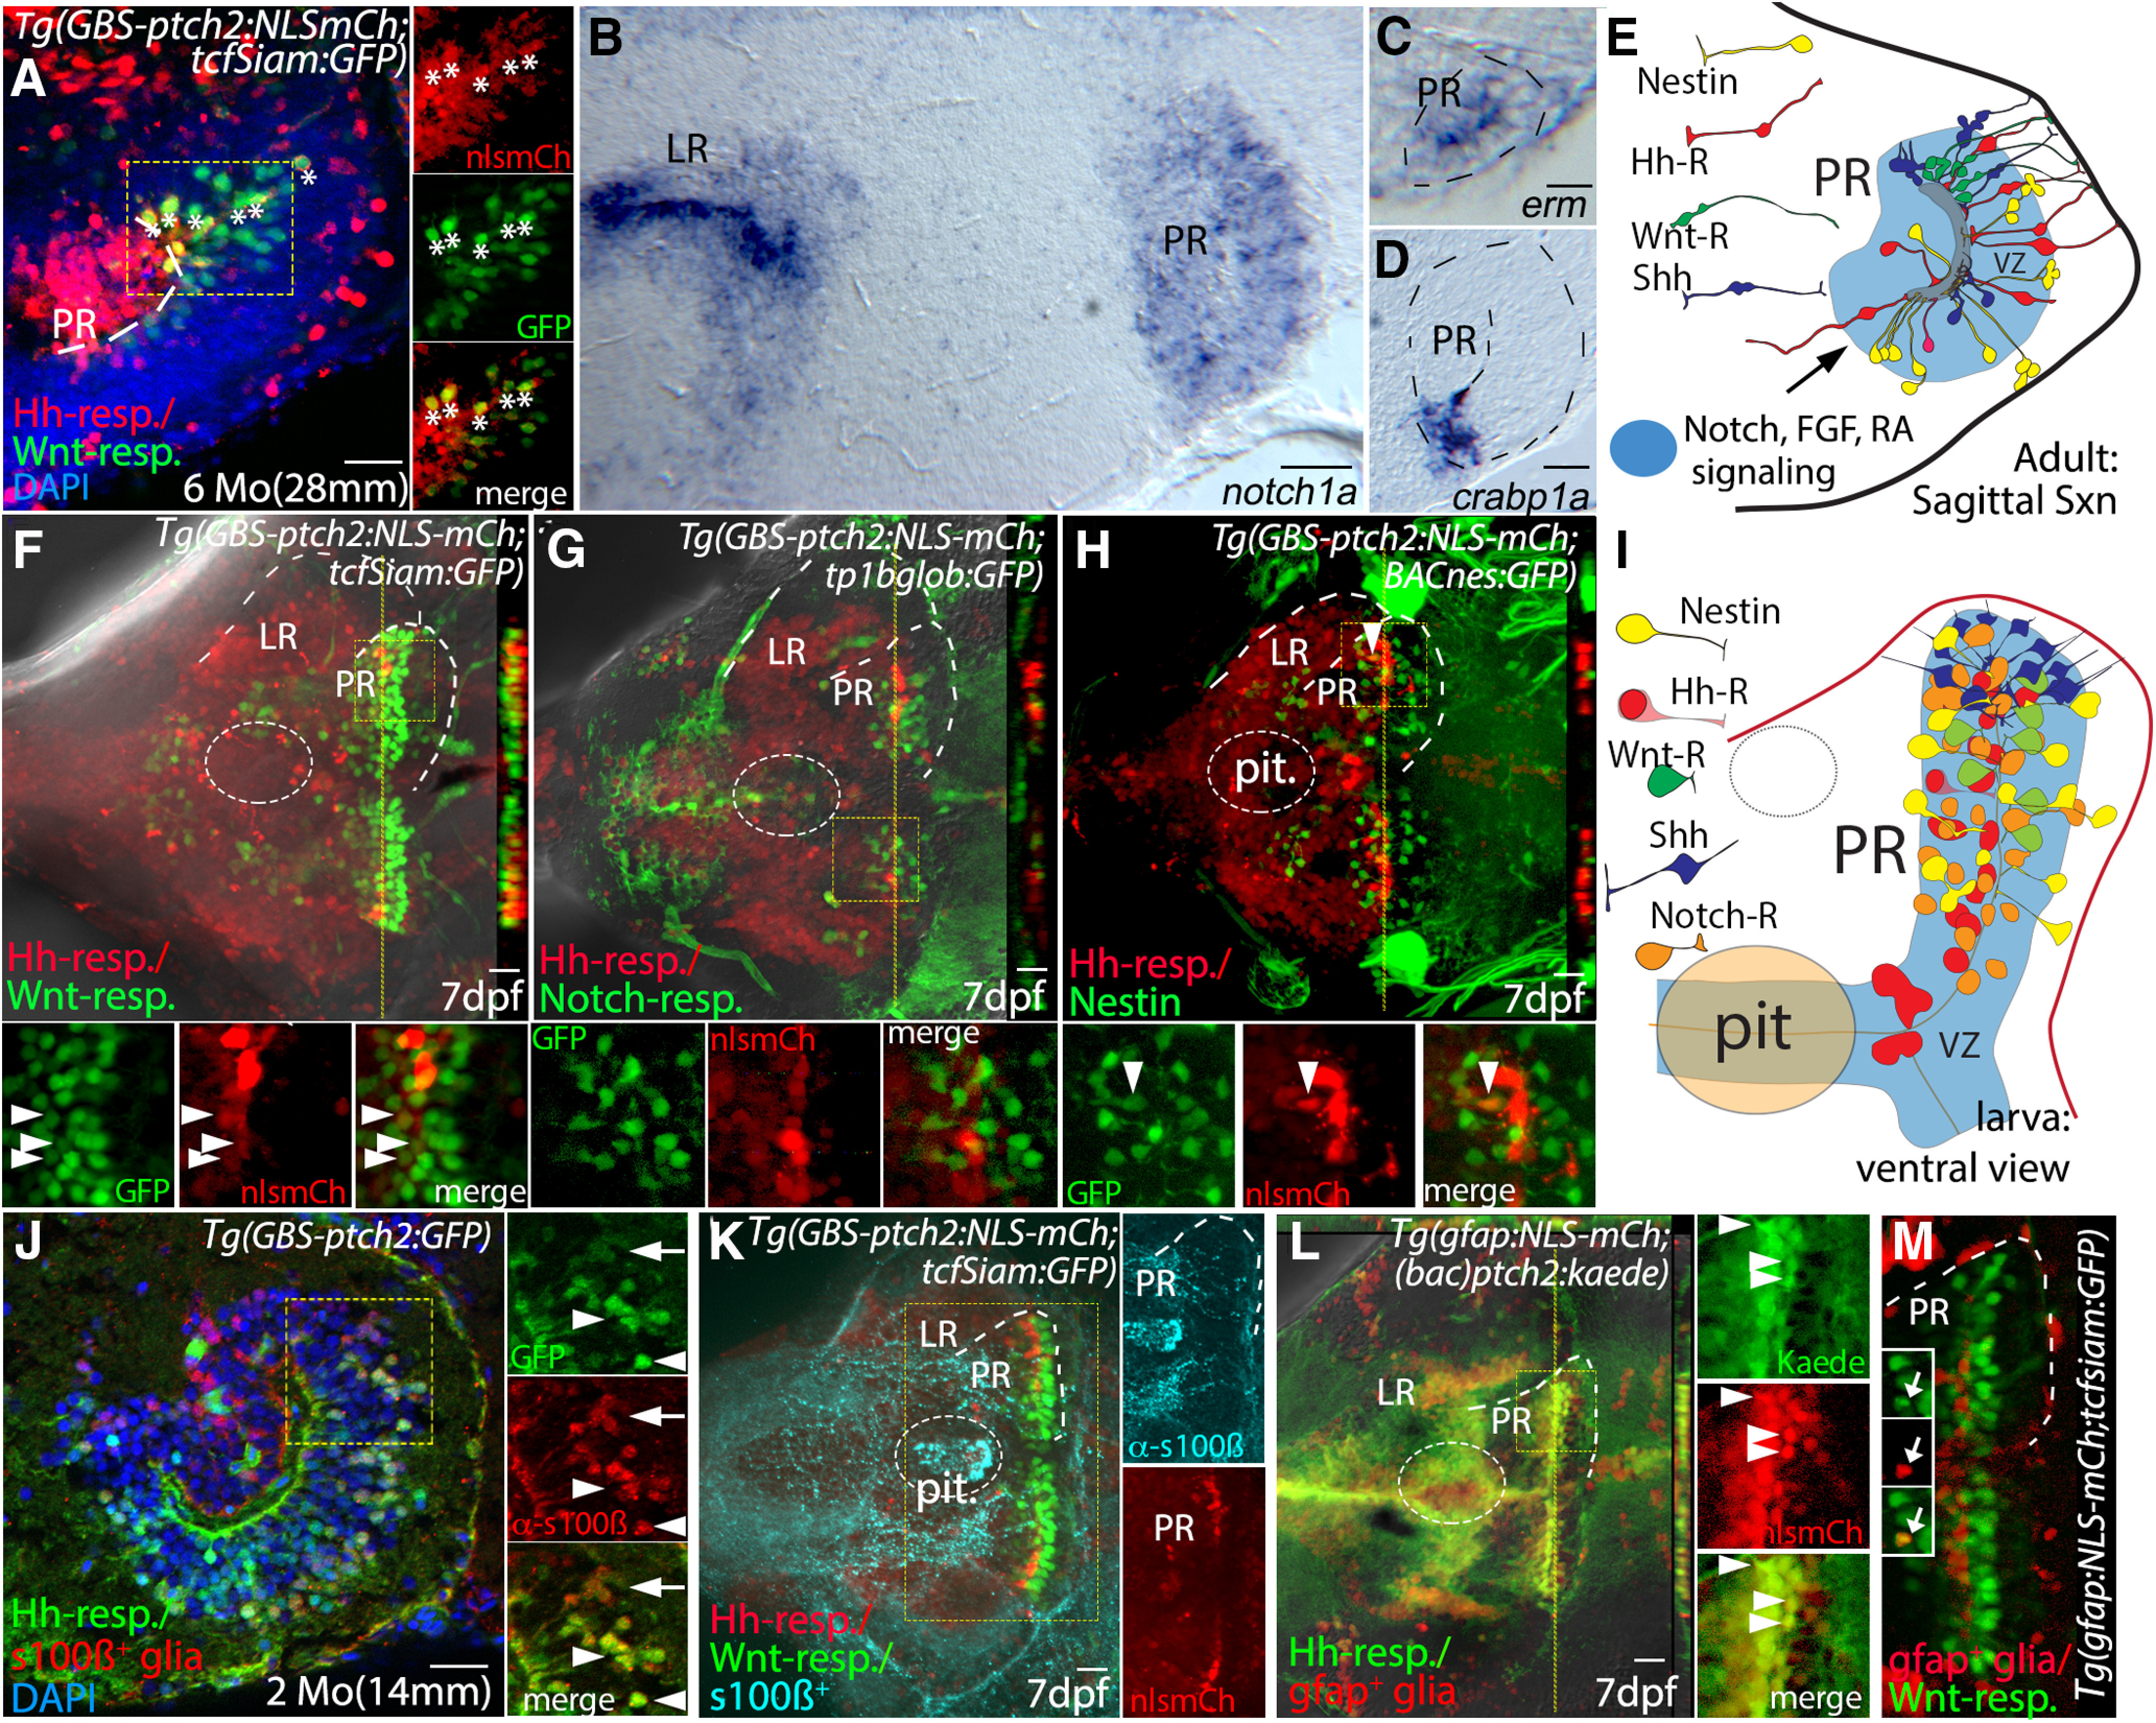
IMAGE

Figure 6.

ID
ZDB-IMAGE-201231-4
Source
Figures for Male et al., 2020
Image
Figure Caption

Figure 6.

Hh, Wnt, Notch, FGF, and retinoic acid signaling in a complex hypothalamic neurogenic niche. A, Sagittal section through the PR of a Tg(GBS-ptch2:NLS-mCherry;TCFSiam:GFP) double transgenic adult. Hh-responsive cells (red) of the PR are largely distinct from Wnt-responsive cells (green); however, a subset of cells in the dorsal PR contains both GFP and mCherry (asterisks). Panels at right show separated channels from the boxed region. B, Sagittal section through the hypothalamus showing notch1a expression in the LR and PR, as visualized by in situ hybridization. C, D, Sagittal section through the PR showing expression of the FGF target gene erm (Raible and Brand, 2001) and the retinoic acid binding protein gene crabp1a (Liu et al., 2005). E, Schematic of cell-cell signaling systems of the PR, including four distinct radial glial types that are defined by reporter gene expression (see Figs. 1-3 for data used to draw Shh-expressing and nestin-expressing cells). F–H, Ventral views of the 7-dpf hypothalamus of double transgenic larvae. Dotted lines outline the ventricular regions of LR and PR, and cut views at right show optical Z-sections through the PR at the position of the yellow dotted line. F, Larval Hh-responsive cells of the PR are distinct from Wnt-responsive cells, as revealed in Tg(GBS-ptch2:NLS-mCherry;TCFSiam:GFP) double transgenic larva. G, Hh-responsive and Notch-responsive cells of the PR are also distinct, as revealed in Tg(GBS-ptch2:NLS-mCherry;tp1bglob:GFP) double transgenic larva. H, Hh-responsive cells of the PR are distinct from nestin-expressing cells, as revealed in Tg(GBS-ptch2:NLS-mCherry;nes:EGFP) double transgenic larva. I, Schematic ventral view of the larval hypothalamus showing cell-signaling pathways examined and four distinct radial glial types, as defined by gene expression in fluorescent reporter lines. Note that the data do not rule out the possibility that subsets of different signal-responsive cells may overlap both spatially and temporally. J, Sagittal section through the PR of a Tg(GBS-ptch2:GFP) adult labeled with the anti-s100β antibody. A total of 482 of 633 (76%) s100β-expressing cells were Hh responsive based on double labeling (arrowheads), while 482 of 533 (90%) of Hh-responsive cells co-labeled with the s100β antibody (n = 6 sections from 2 brains). Weakly labeled S100β cells tended to correspond to the more weakly fluorescent GFP+ cells (arrows). K, In 7-dpf larvae, S100β was only weakly expressed in the PR, despite strong expression in other regions of the brain and pituitary (ventral view). L, Ventral view of a Tg(gfap:NLS-mCherry;GBS-ptch2:kaede) double transgenic larva. A total of 176 of 474 (37%) of gfap-expressing cells counted were Hh responsive based on Kaede expression (arrowheads). Conversely, 176 of 463 (35%) Hh-R cells counted expressed the gfap transgene (n = 10 larvae). M, Ventral view of a Tg(gfap:NLS-mCherry;tcfsiam:GFP) double transgenic larva. Only 12 of 572 (2%) Wnt-R cells examined expressed the gfap transgene (insets, arrows; n = 10 embryos). pit, pituitary. Scale bars: 20 μm.

Acknowledgments
This image is the copyrighted work of the attributed author or publisher, and ZFIN has permission only to display this image to its users. Additional permissions should be obtained from the applicable author or publisher of the image. Full text @ eNeuro