IMAGE

Figure 2.

ID
ZDB-IMAGE-201231-13
Source
Figures for Male et al., 2020
Image
Figure Caption

Figure 2.

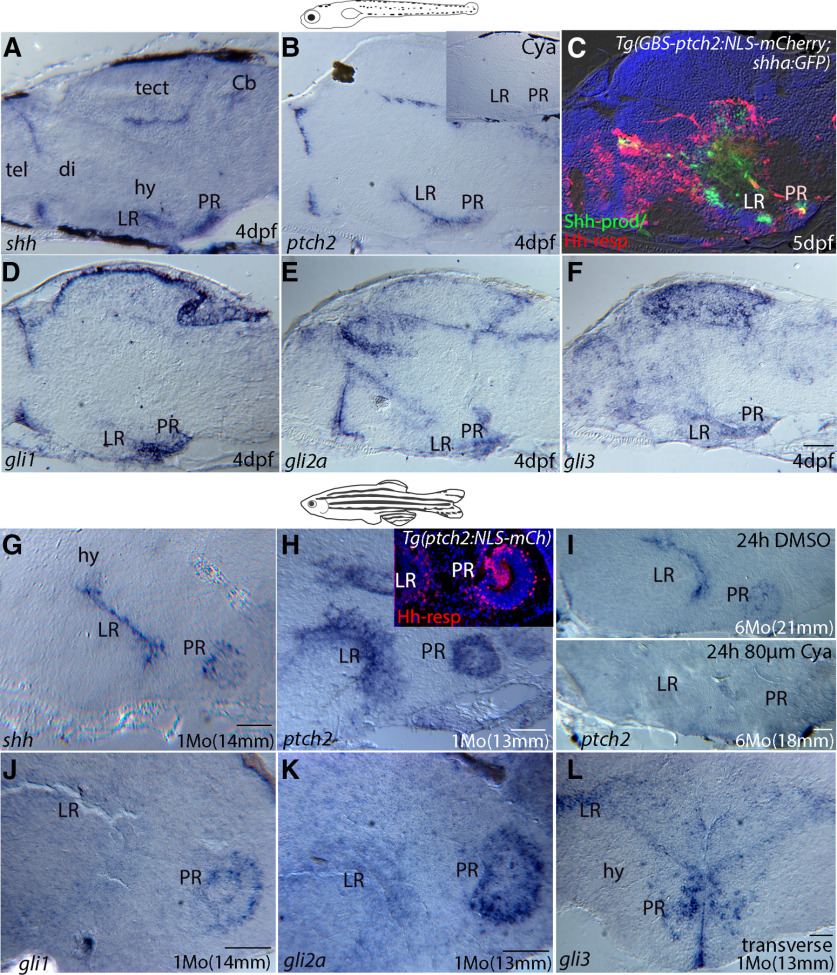
Hh pathway gene expression in the larval and adult zebrafish hypothalamus. A–F, Expression of Hh-signaling pathway genes in sectioned tissue from 4-dpf larvae. A, In situ hybridization (ISH) showing that shh is highly expressed in the ventricular regions of the LR and PR of the hypothalamic ventricle, as well as in ventricular regions of the diencephalon/telencephalon border, cerebellum, and tectum. B, The Hh-target gene patched2 is similarly expressed in ventricular regions throughout the larval brain, with ptch2 transcription being eliminated by treatment with Cya (B, inset). C, Shh-producing (green, Shh-prod) and ptch2 (red, Hh-resp) expression in the larval brain as revealed by the Tg(shha:GFP) and Tg(GBS-ptch2:NLS-mCherry) reporter lines, seen here in a double transgenic larva. This midline section reveals Hh response in the midline ventricular region. D–F, ISH showing expression of the Hh-responsive transcription factors gli1, gli2a, and gli3, respectively. G–L, ISH on tissue sections showing expression of Hh signaling pathway genes in the adult hypothalamus. G, shh expression is maintained in the LR and PR of the adult hypothalamic ventricle. H, Expression of the Hh-target gene patched2 in the hypothalamic ventricular regions as revealed by ISH and compared with nuclear mCherry expression in cells of the LR and PR driven by the ptch2 promoter construct in the Tg(GBS-ptch2:NLS-mCherry) transgenic line (inset). I, ISH using a ptch2 probe shows that Cya treatment (bottom panel) of six-month-old adult dramatically reduced ptch2 gene expression in the LR and PR compared with an age-matched DMSO control treated fish (top panel). J–L, ISH showing expression of the Hh-responsive transcription factors gli1, gli2a, and gli3, respectively, in the hypothalamus. All panels show sagittal tissue sections, except L, which shows a transverse tissue section. cb, cerebellum; di, diencephalon; hy, hypothalamus; tect, tectum; tel, telencephalon. Scale bars: 50 μm.

Acknowledgments
This image is the copyrighted work of the attributed author or publisher, and ZFIN has permission only to display this image to its users. Additional permissions should be obtained from the applicable author or publisher of the image. Full text @ eNeuro