IMAGE

FIGURE 6

ID
ZDB-IMAGE-201230-8
Source
Figures for Delbaere et al., 2020
Image
Figure Caption

FIGURE 6

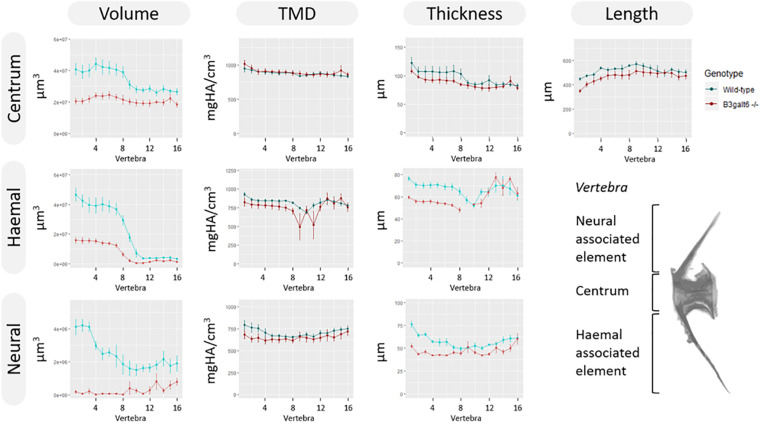
μCT analysis of adult WT and b3galt6–/– zebrafish. Quantitative μCT analysis of the vertebral column in five mutants vs. five WT zebrafish at the age of 4 months. The bone volume, tissue mineral density (TMD) and bone thickness were calculated for three parts of each vertebra: the vertebral centrum, the neural associated element (neural arch and neural spine) and the haemal associated element (haemal arch and haemal spine). Plots associated with a significant difference are colored in a lighter coloring scheme. The X-axis represents each vertebra along the anterior-posterior axis. The volume is significantly reduced for each part of the vertebra in b3galt6–/– zebrafish (P < 0.01, P < 0.001, and P < 0.000001, respectively). The thickness of the haemal (P < 0.01) and neural (P = 0.001) associated element is also significantly reduced in the mutants whereas the centrum thickness is not significantly reduced in b3galt6–/– zebrafish (P = 0.12). TMD is not significantly different between b3galt6–/– zebrafish and WT siblings when not normalized for standard length (P > 0.2). Data are presented as mean ± SEM. TMD, tissue mineral density; HA, hydroxyapatite.

Figure Data
Acknowledgments
This image is the copyrighted work of the attributed author or publisher, and ZFIN has permission only to display this image to its users. Additional permissions should be obtained from the applicable author or publisher of the image. Full text @ Front Cell Dev Biol