IMAGE

Figure 2

ID
ZDB-IMAGE-201230-39
Genes
Source
Figures for Epting et al., 2020
Image
Figure Caption

Figure 2

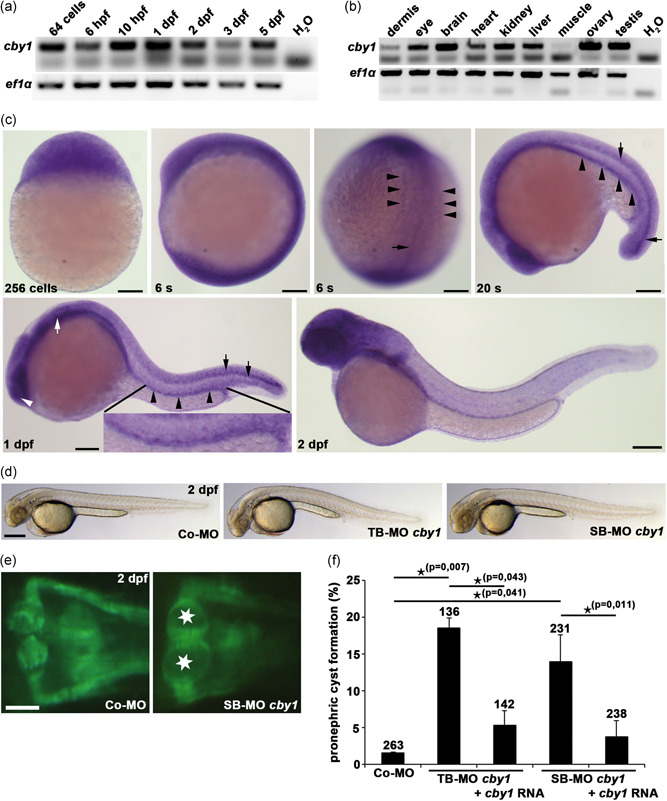
Zebrafish studies showing temporal and spatial expression of cby1 and evidence of a ciliopathy phenotype after cby1 knockdown. (a) Semiquantitative reverse‐transcription polymerase chain reaction (RT‐PCR) analysis reveals maternal expression of cby1 at the 64‐cell stage and expression of cby1 throughout embryogenesis. ef1α served as a loading control. (b) Semiquantitative RT‐PCR analysis reveals expression of cby1 in most adult zebrafish organs analyzed, with prominent expression in eye, brain, kidney, liver, ovary, and testis. ef1α served as a loading control. (c) Whole mount in situ hybridization analysis for cby1 in zebrafish. Maternal cby1 transcripts are ubiquitously distributed at the 256‐cell stage. Broad expression of cby1 at six‐somite stage (6s) with specific expression in axial mesoderm (black arrow) and pronephric mesoderm (black arrowheads). At 20‐somite stage (20s), cby1 shows expression in the developing pronephric tubule (black arrowheads) and ventral spinal cord (black arrows). At 1 day post‐fertilization (1 dpf), expression of cby1 is detected in ciliated organs including the nasal placode (white arrowhead), otic vesicle (white arrow), neural tube (black arrows), and pronephric tubule (black arrowheads). At 2 dpf, cby1 has a broad expression in the head. Scale bars = 100 µm. (d) Brightfield images showing overall morphology of 2dpf zebrafish embryos injected with control morpholino (Co‐MO), translation‐blocking morpholino (TB‐MO) cby1, and splicing‐blocking morpholino (SB‐MO) cby1. Scale bar = 100 µm. (e) Knockdown of cby1 results in pronephric cyst formation (stars), as shown in a dorsal view with anterior to the top of a Tg(wt1b:EGFP) zebrafish embryo at 2 dpf. Scale bar = 5 µm. (f) Quantification of pronephric cyst formation in 2dpf zebrafish embryos injected with Co‐MO, TB‐MO cby1, TB‐MO cby1 + cby1 mRNA, SB‐MO cby1, and SB‐MO cby1 + cby1 mRNA. There was significant prevention of pronephric cyst formation upon coinjection of cby1 mRNA. The number of individual embryos analyzed is indicated above each bar

Figure Data
Acknowledgments
This image is the copyrighted work of the attributed author or publisher, and ZFIN has permission only to display this image to its users. Additional permissions should be obtained from the applicable author or publisher of the image. Full text @ Hum. Mutat.