
|
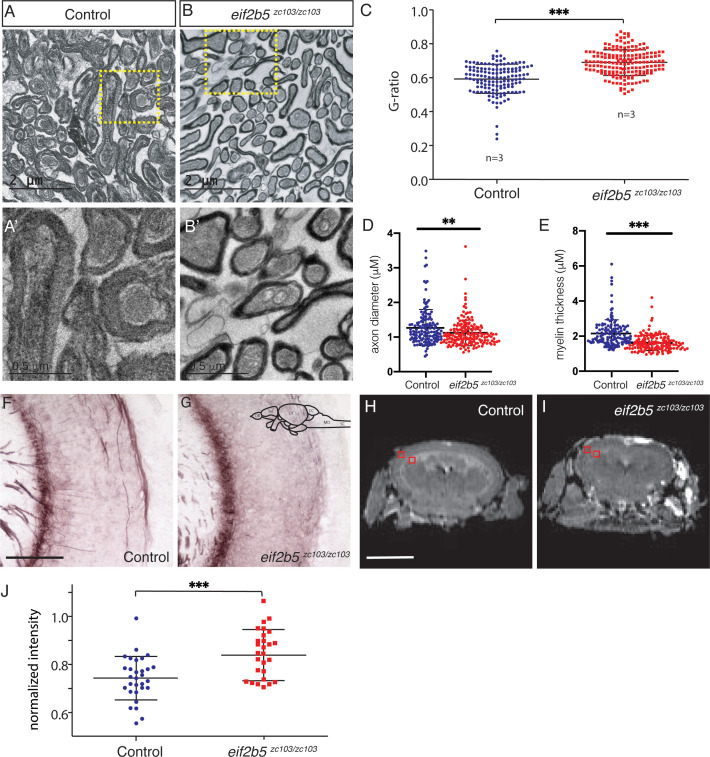
Figure 6 Adult eif2b5zc103/zc103 mutants show myelin defects. (A–C) Transmission electron microscopy (TEM) of adult eif2b5zc103/zc103 optic nerve compared to eif2b5+/+ adults. Scale bar 2 μm. (A) eif2b5+/+ adult TEM image. (B) eif2b5zc103/zc103 adult TEM image. (A’, B’) Higher magnification views of insets represented in (A) and (B), scale bar 0.5 μm. (C–E). Comparison of ratio between axon perimeter and myelin sheath perimeter, G-ratio, between eif2b5zc103/zc103 and eif2b5+/+; axon diameter and myelin thickness quantification shown. (F–G) Black Gold stain of adult eif2b5zc103/zc103 optic tectum compared to eif2b5+/+ adults. Scale bar 5 μm. (F) eif2b5+/+ adult Black Gold stained image. (G) eif2b5zc103/zc103 adult Black Gold stained image. (H–J) Magnetic Resonance Image (MRI) of adult eif2b5zc103/zc103 compared to eif2b5+/+. Scale bar 2 mm. Slice scheme of MRI images from the rhombencephalic ventricle (RV) at the end of the midbrain moving rostrally. (H) eif2b5+/+ adult T2 MRI image slice 1. (I) eif2b5zc103/zc103 adult T2 MRI of slice 1. (J) T2 intensity analysis. The normalized change in intensity from the from grey matter region of the optic tectum to the white matter region of the periventricular grey zone of the optic tectum, indicated by red boxes.