IMAGE

Fig. 7.

ID
ZDB-IMAGE-201223-47
Source
Figures for Kelu et al., 2020
Image
Figure Caption

Fig. 7.

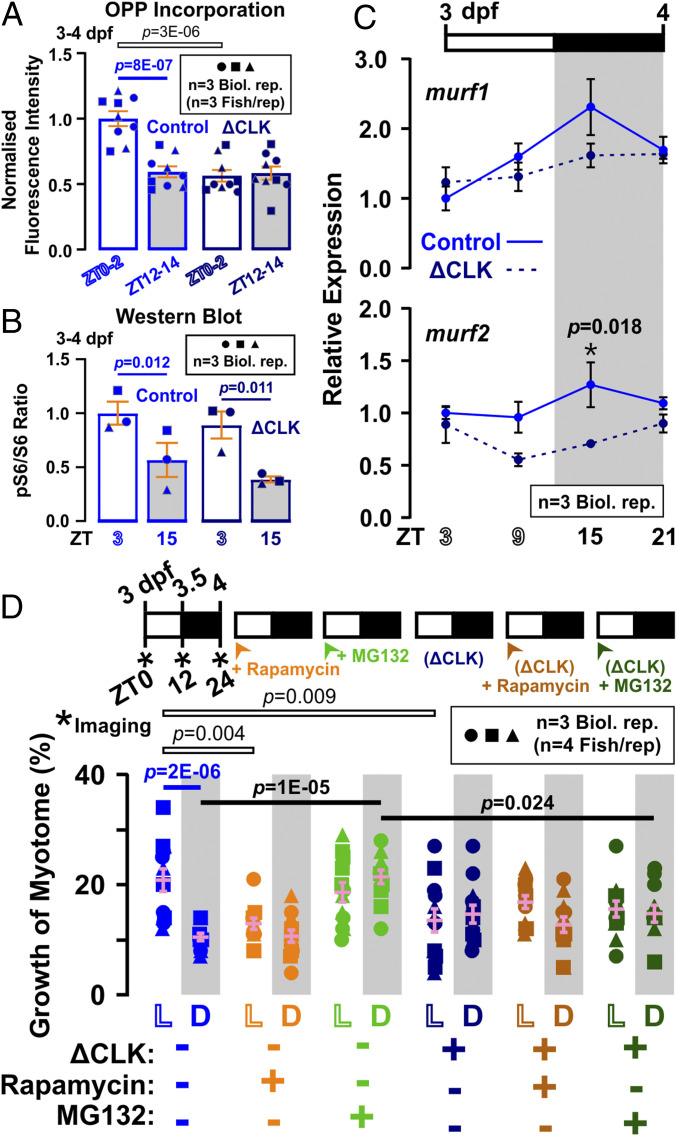
Effects of ΔCLK expression on protein metabolism in zebrafish larvae. Control (light blue) and ΔCLK (dark blue) larvae were raised under LD and analyzed between 3 and 4 dpf. (A) Quantification of nascent protein visualized in somite 17 by OPP incorporation at ZT0 to ZT2 and ZT12 to ZT14 (n = 9 fish from three biological replicates; confocal images shown in SI Appendix, Fig. S9C). Signals were normalized to Control ZT0 to ZT2 samples after subtraction of CHX background. (B) Quantification of pS6/S6 ratio at ZT3 and ZT15 (n = 3 biological replicates). Ratios were normalized to control samples at ZT3. Symbols represent distinct lays (biological replicates shown in SI Appendix, Fig. S9D). (C) Diurnal variation in level of atrophy-related genes murf1 and murf2 (n = 3 biological replicates); ef1a was used for normalization. Control strengthens results in Fig. 4A; ΔCLK lacks peak at ZT15. (D) Growth of the myotome (percent) measured between 3 and 4 dpf in α-actin:mCherryCAAX Control (light colors) and ΔCLK (dark colors) larvae that were treated from 3 dpf with either DMSO vehicle (blue), 10 µM rapamycin (orange), or 10 µM MG132 (green). Symbols represent distinct lays (n = 12 fish from three biological replicates). Note that, although the effect of ΔCLK alone to increase nighttime growth did not reach the cutoff for significance in this experimental series (P = 0.36) or that in Fig. 6E (P = 0.47), when both datasets were pooled, ΔCLK caused a significant increase in growth at night (P = 0.022). Similar pooled analysis of the reduction by ΔCLK of daytime growth also increased confidence in the difference (P = 2E-06).

Acknowledgments
This image is the copyrighted work of the attributed author or publisher, and ZFIN has permission only to display this image to its users. Additional permissions should be obtained from the applicable author or publisher of the image. Full text @ Proc. Natl. Acad. Sci. USA