IMAGE

Fig. 4.

ID
ZDB-IMAGE-201223-44
Source
Figures for Kelu et al., 2020
Image
Figure Caption

Fig. 4.

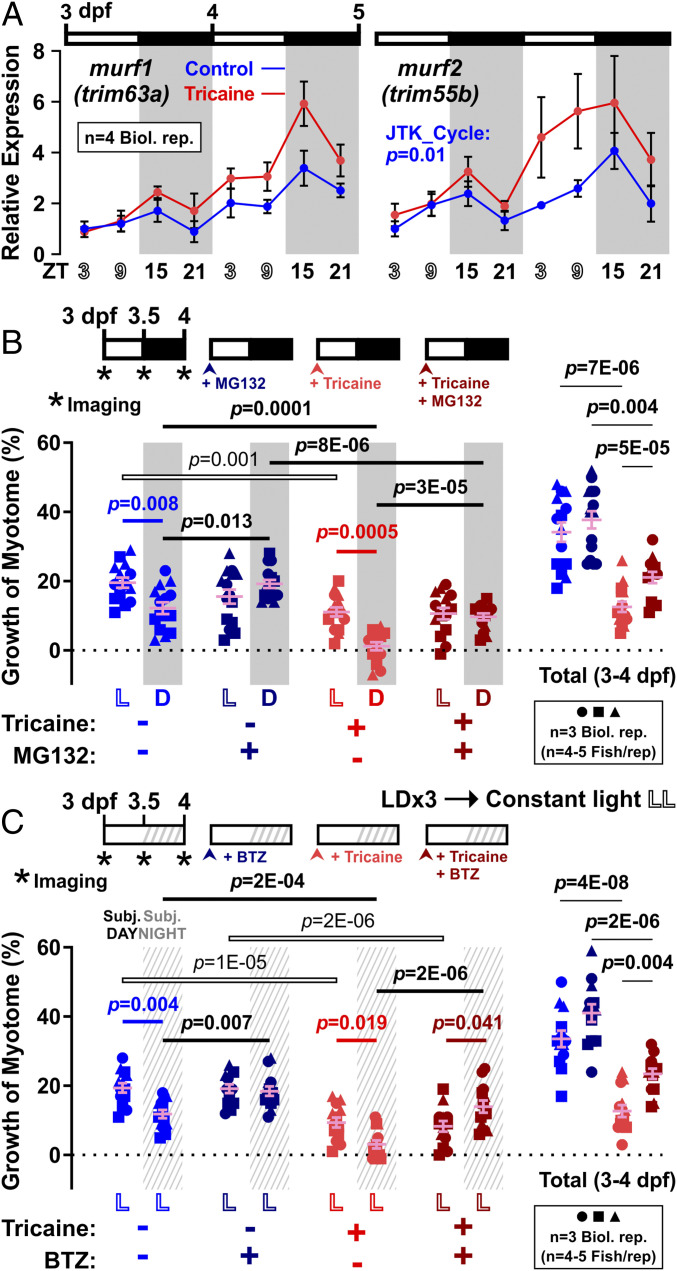
Nocturnal peak in atrogene expression parallels enhanced muscle growth at night in response to proteasome inhibitors. Larvae raised under LD were either untreated (Control, blue) or anesthetized (Tricaine, red). (A) Expression of atrophy-related genes murf1/trim63a and murf2/trim55b was assayed by qPCR on total RNA collected every 6 h between 3 and 5 dpf (n = 4 biological replicates); ef1a was used for normalization. Statistic represents JTK_Cycle (see Methods). (B) Growth of myotome (percent) in larvae that were also treated from 3 dpf with either DMSO vehicle (light colors) or 10 µM MG132 (dark colors). Symbols represent distinct lays (n = 14 or 15 fish from three biological replicates). (C) Growth of myotome (percent) in larvae that were entrained under LD and then at 3 dpf transferred to constant light (LD→LL) and simultaneously treated with either DMSO vehicle (light colors) or 1 µM BTZ (dark colors). Symbols represent distinct lays (n = 13 fish from three biological replicates). Note that DMSO data strengthen the result in Fig. 1B.

Acknowledgments
This image is the copyrighted work of the attributed author or publisher, and ZFIN has permission only to display this image to its users. Additional permissions should be obtained from the applicable author or publisher of the image. Full text @ Proc. Natl. Acad. Sci. USA