IMAGE

Fig. 3.

ID
ZDB-IMAGE-201223-43
Source
Figures for Kelu et al., 2020
Image
Figure Caption

Fig. 3.

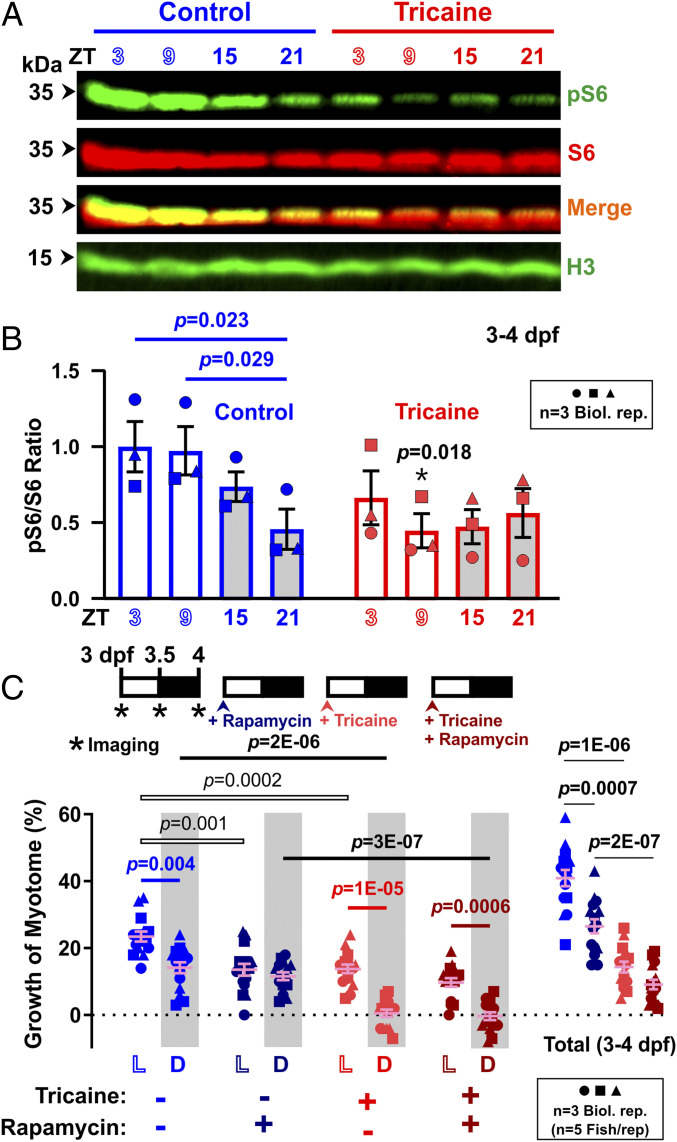
TORC1 signaling varies diurnally and is required for activity-driven daytime growth. Larvae raised under LD that were either untreated (Control, blue) or anesthetized (Tricaine, red) from 3 dpf to 4 dpf. (A) Western analysis of phospho-ribosomal protein S6 (pS6), total RpS6 (S6), and Histone H3 loading control (H3) in total protein extracted from whole larvae every 6 h over a 24-h period between 3 dpf and 4 dpf, at ZT3, ZT9, ZT15, and ZT21. (B) Quantification of pS6/S6 ratio (n = 3 biological replicates, shown in SI Appendix, Fig. S5). Ratios were normalized to control samples at ZT3. (C) Growth of the myotome (percent) in larvae that were also treated with either DMSO vehicle (light colors) or 10 µM rapamycin (dark colors). Symbols represent distinct lays (n = 15 fish, from three biological replicates). Note that DMSO data strengthen the result in Fig. 1B.

Acknowledgments
This image is the copyrighted work of the attributed author or publisher, and ZFIN has permission only to display this image to its users. Additional permissions should be obtained from the applicable author or publisher of the image. Full text @ Proc. Natl. Acad. Sci. USA