IMAGE

Fig. 1.

ID
ZDB-IMAGE-201223-41
Source
Figures for Kelu et al., 2020
Image
Figure Caption

Fig. 1.

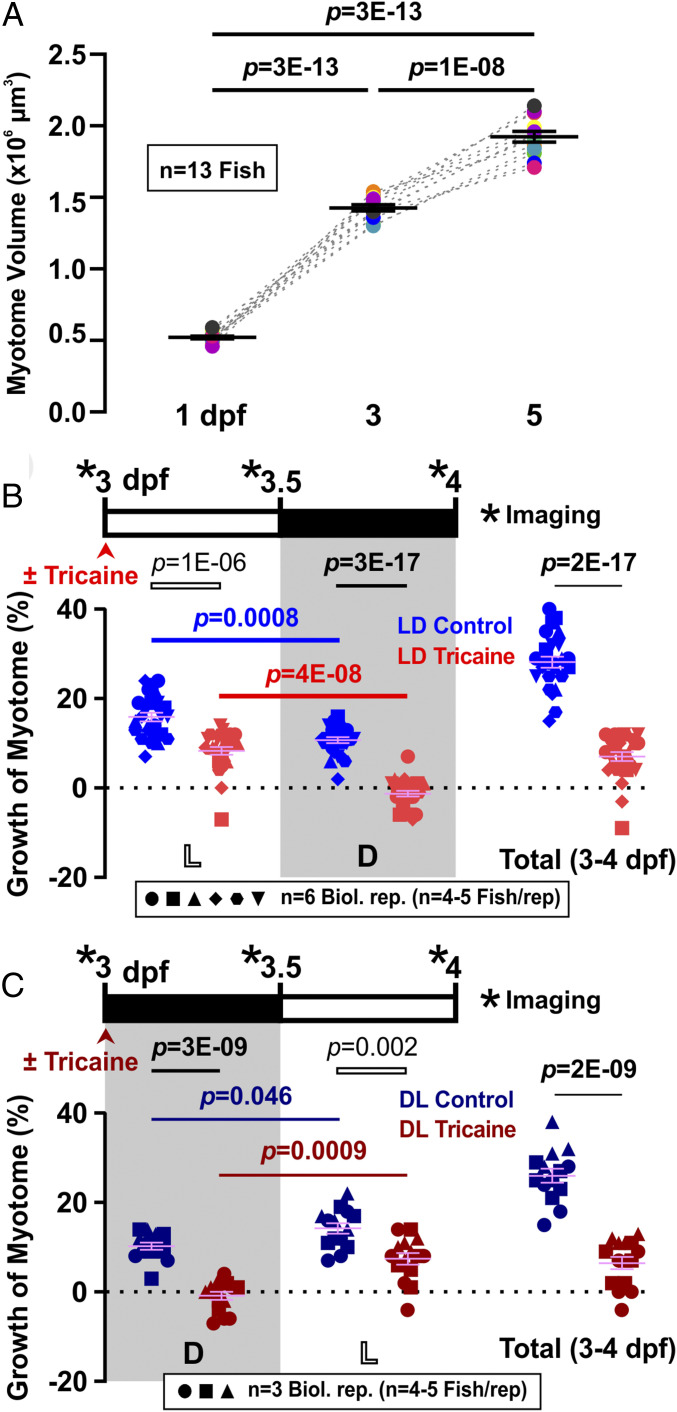
Diurnal variation and requirement for activity in volumetric growth of the myotome. (A) Growth of myotome in somite 17 between 1 and 5 dpf. Black bars represent mean ± SEM. Colors represent different individual fish from a single lay (n = 13 fish). (B and C) Larvae raised under LD (B; n = 25 or 26 fish from six biological replicates) or DL (C; n = 14 or 15 fish from three biological replicates) were either untreated (Control, blue/dark blue) or anesthetized (Tricaine, red/dark red) from 3 dpf to 4 dpf. Confocal imaging was performed every 12 h (*) over the 24-h period to measure myotome volume. Graphs show growth of myotome (percent) of individual fish over each 12-h period (left and center) or the full 24 h (right). Complete data on the same LD fish are shown in SI Appendix, Fig. S2 A and B. Symbol shapes distinguish biological replicates from separate lays. L, light; D, dark.

Acknowledgments
This image is the copyrighted work of the attributed author or publisher, and ZFIN has permission only to display this image to its users. Additional permissions should be obtained from the applicable author or publisher of the image. Full text @ Proc. Natl. Acad. Sci. USA