IMAGE

Fig. 5

ID
ZDB-IMAGE-201214-6
Genes
Source
Figures for Stratman et al., 2020
Image
Figure Caption

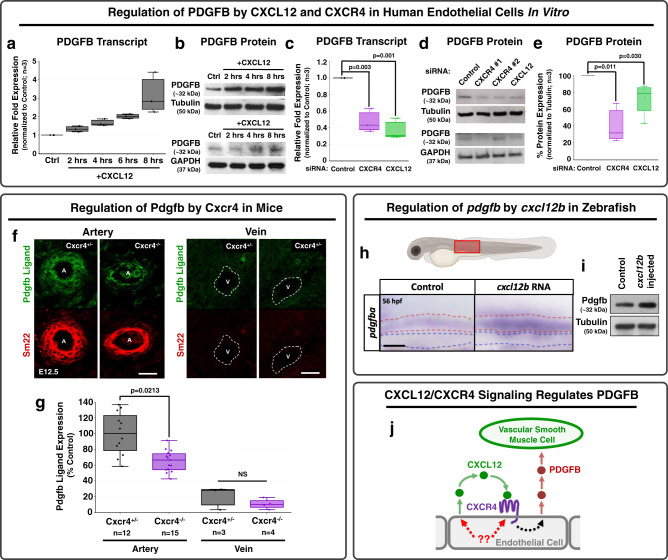
Fig. 5 Chemokine signaling regulates PDGFB transcript and protein levels across species.

a, b PDGFB transcript (a) and protein (b) in HUVEC cells cultured in vitro in a confluent cell monolayer for up to 8 h with (“+CXCL12”) or without (“CTRL”) added recombinant CXCL12. Relative PDGFB transcript levels (a) and protein levels (b) were measured by qPCR and Western blot, respectively, showing an upregulation of both PDGFB transcript and PDGFB protein levels in response to stimulation by CXCL12. The PDGFB western blots are shown in comparison to two loading controls, tubulin and GAPDH. ce PDGFB transcript (c) and protein levels (d, e) in HUVEC cells cultured in vitro in a confluent cell monolayer and treated with either control, CXCR4 (target #1 or target #2- all experimental quantification utilizes siRNA target #1), or CXCL12 siRNAs. Relative PDGFB transcript (c) and protein (e, f) levels were measured by qPCR and western blot, respectively, showing suppression of both PDGFB transcript and protein in response to either CXCR4 or CXCL12 knockdown. The PDGFB western blots are shown in comparison to two loading controls, tubulin (top) and GAPDH (bottom), and the quantification is normalized to tubulin expression. Values in a, c, and e are representative of three individual experiments and expressed as a percentage of control. Samples are generated by pooling 20 individual embryos per condition. (a, c). n = 3 for all in vitro experiments. f Confocal images of immunohistochemically stained transverse sections through large arteries and large veins of E12.5 Cxcr4+/− heterozygous sibling (left) and Cxcr4−/− mutant (right) mice, probed for platelet-derived growth factor B (PDGFB; green) and for smooth muscle 22 alpha (SM22, aka transgelin) for vascular smooth muscle cells (vSMC, red). g Quantification of relative PDGFB protein expression in Cxcr4+/− heterozygous embryos (black bars; n = 12 arteries, n = 3 veins) versus Cxcr4−/− homozygous mutant embryos (purple bars; n = 15 arteries, n = 4 veins). Values are expressed as a percentage of the heterozygous control condition and images were acquired from three to five individual mice per condition. h Schematic diagram of a zebrafish larva with the red box highlighting the area imaged in the lower panels. Lower panels: Whole mount in situ hybridization of the mid-trunk of 56 hpf zebrafish injected with control (left) or cxcl12b (right) RNA at the one-cell stage, showing upregulation of pdgfba transcript in response to exogenous cxcl12b. Red and blue dotted lines in the panels indicate the dorsal aorta and cardinal vein, respectively. Images are representative of 20 embryos. i Western blot of whole embryo protein lysate from 54 hpf zebrafish injected with either control (left) or cxcl12b (right) RNA, probed for pdgfb (top) or alpha tubulin (bottom), showing upregulation of pdgfb protein levels in response to exogenous overexpression of cxcl12b. Images are representative of data from three individual experiments. j Schematic diagram illustrating the proposed model for endothelial-autonomous chemokine signaling driving increased endothelial PDGFB ligand production, thereby indirectly promoting vSMC acquisition by arteries. Putative upstream regulators of CXCL12 and CXCR4 are noted in red. Scale bars = 100 µm (f) and 50 µm (h). Box plots are graphed showing the median versus the first and third quartiles of the data (the middle, top, and bottom lines of the box, respectively). The whiskers demonstrate the spread of data within 1.5x above and below the interquartile range. All data points are shown as individual dots, with outliers shown above or below the whiskers. P-values are indicated above statistically significant datasets. Statistics in panels c, e were run using one-way ANOVA and g using two-way ANOVA to calculate the P-values.

Figure Data
Acknowledgments
This image is the copyrighted work of the attributed author or publisher, and ZFIN has permission only to display this image to its users. Additional permissions should be obtained from the applicable author or publisher of the image. Full text @ Commun Biol