IMAGE

Fig. 6

ID
ZDB-IMAGE-201212-18
Source
Figures for Issaka Salia et al., 2020
Image
Figure Caption

Fig. 6

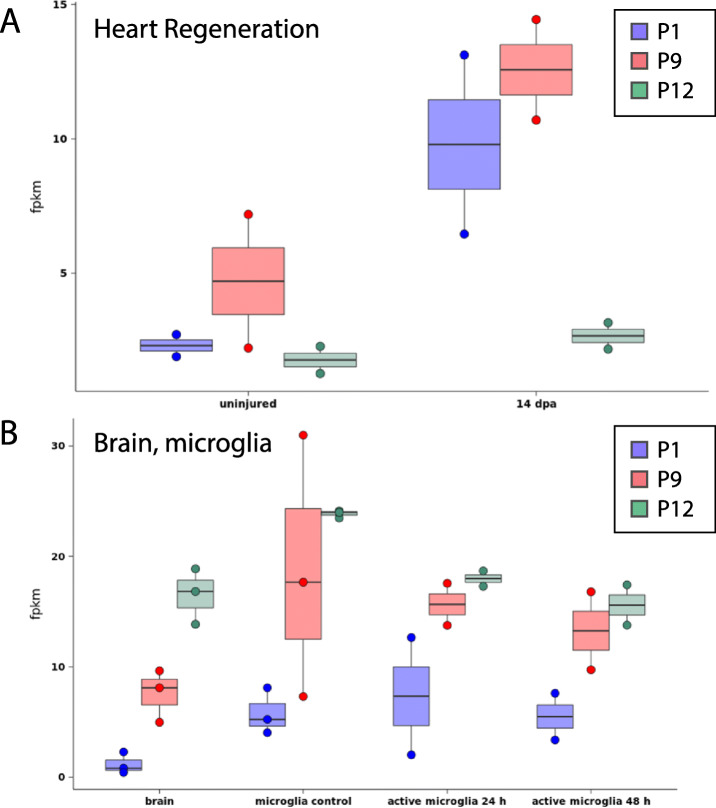
Expression level of selected zebrafish genes in other published studies. Expression level of selected zebrafish genes (P1, P9, and P12) in other published RNA-seq datasets of (a) zebrafish heart regeneration [64], and (b) zebrafish brain microglia [52] using the Zf Regeneration Database (www.zfregeneration.org, [65]). The y-axis indicates the normalized transcript level expressed as fpkm (fragments per kilobase of exon per million reads). On the x-axis is the different experimental conditions. (A,  dpa =  days post injury. B, active microglia indicates responding to acute damage, h = hours after acute damage)

Acknowledgments
This image is the copyrighted work of the attributed author or publisher, and ZFIN has permission only to display this image to its users. Additional permissions should be obtained from the applicable author or publisher of the image. Full text @ BMC Genomics