
Image
|
Figure Caption
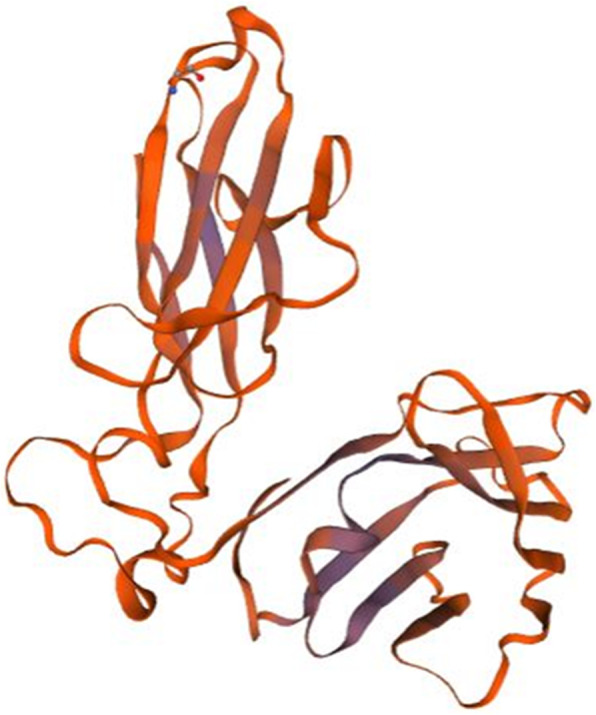
Fig. 3
Homology model of P3. T cell receptor beta chain (3of6.1.A in the rcsb protein database) is the template used for the homology modelling of P3. The homology model starts from the P3 residue N°32 (THR, Threonine) and ends with the residue N° 245 (THR, Threonine). The X-RAY diffraction 2.80 Å was used to determine the experimental structure of 3of6.1.A [
Acknowledgments
This image is the copyrighted work of the attributed author or publisher, and
ZFIN has permission only to display this image to its users.
Additional permissions should be obtained from the applicable author or publisher of the image.
Full text @ BMC Genomics