IMAGE

Fig. 6.

ID
ZDB-IMAGE-201202-21
Source
Figures for Fornetto et al., 2020
Image
Figure Caption

Fig. 6.

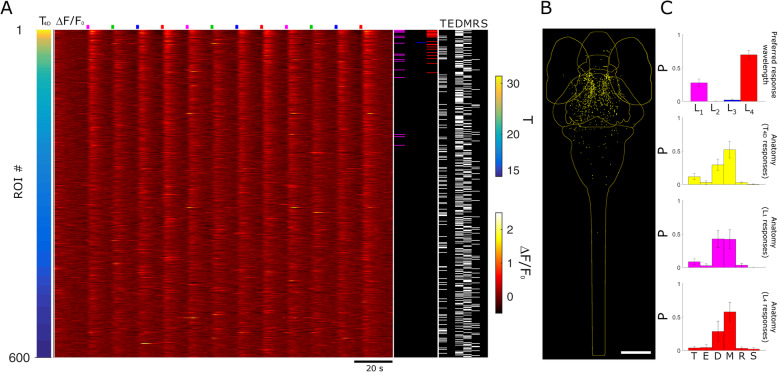
CNS spectral and anatomical mapping in 3-dpf larvae. a ΔF/F0 responses of 600 ROIs ranked by T4D values in a 3-dpf larva. Each row in the heatmap represents a neuron. The left bar indicates neurons’ T4D values (T color scale is displayed on the right of the panel). Stimulus time points are indicated at the top of the panel highlighted in their respective colors. The spectral column on the right shows the spectral responses of the neurons selected above the threshold and peak analysis (highlighted in magenta, green, blue, and red for the response to L1, L2, L3, and L4 stimulus, respectively). The anatomical column shows the localization of each ROI across the CNS regions (T, telencephalon; E, eyes; D, diencephalon; M, mesencephalon; R, rhombencephalon; S, spinal cord). b Anatomical map of neurons selected above the T4D threshold (yellow dots) for 7 larvae at 3 dpf registered onto a reference brain for anatomical localization (light yellow outlines). Scale bar, 150 μm. c Quantification of spectral and anatomical identities (N = 7 larvae). The histogram on the top shows the normalized distribution of all responsive neurons above the TTh4D threshold across the four spectral stimuli (displayed in their respective color codes). The histograms on the bottom quantify the anatomical distributions of the neurons above TTh4D (yellow histogram), TThU (magenta), and TThR threshold (red) (from top to bottom) across the CNS areas abovementioned. Error bars = stderr, N = 7

Acknowledgments
This image is the copyrighted work of the attributed author or publisher, and ZFIN has permission only to display this image to its users. Additional permissions should be obtained from the applicable author or publisher of the image. Full text @ BMC Biol.