IMAGE

Fig. 2.

ID
ZDB-IMAGE-201202-15
Source
Figures for Fornetto et al., 2020
Image
Figure Caption

Fig. 2.

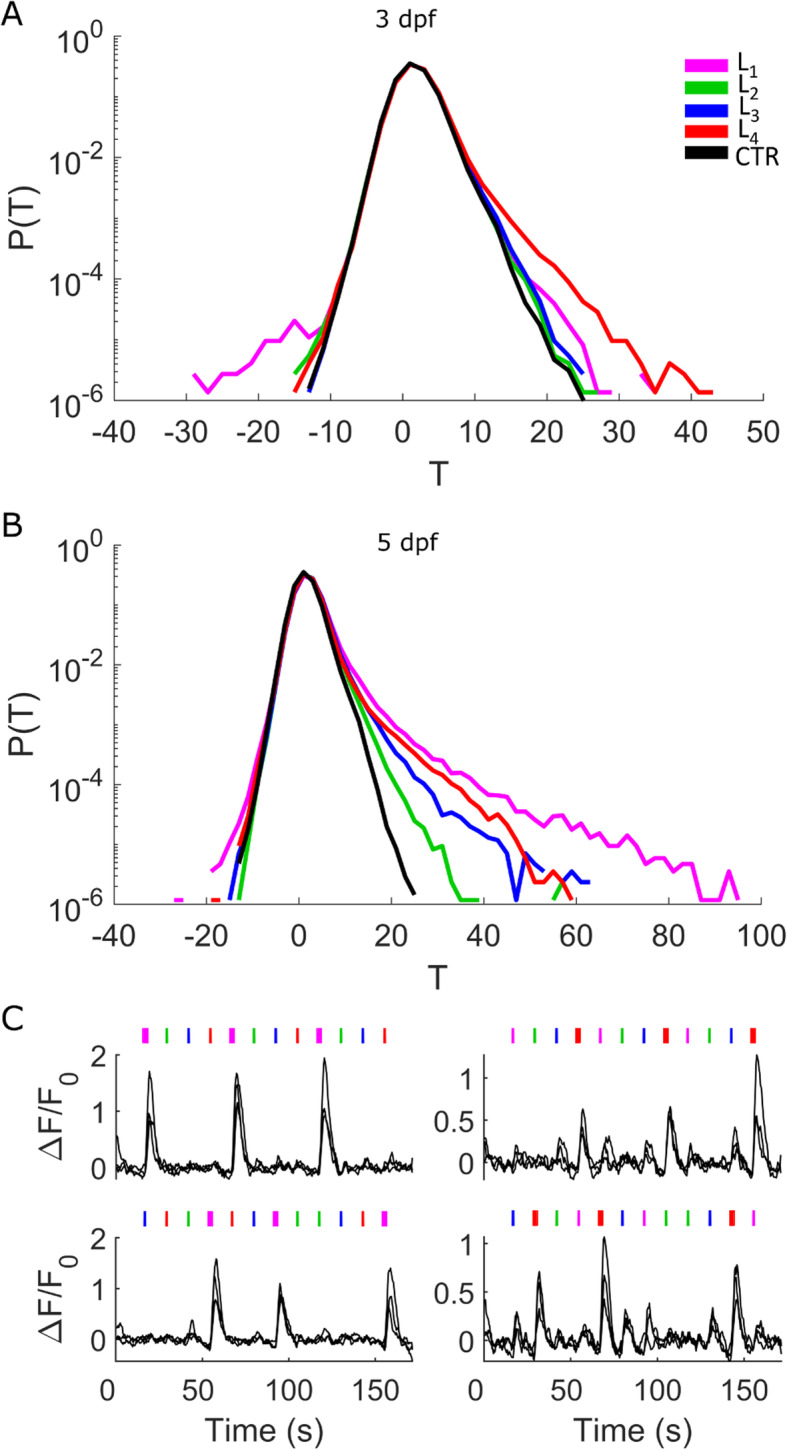
T distributions for stimulated and control larvae at 3 and 5 dpf and spectral identity. Normalized distributions of T values for L1, L2, L3, and L4 stimulation (magenta, green, blue, and red traces, respectively; see legend) and control acquired in the absence of visual stimulation (black trace) measured for 3-dpf larvae (a) and 5-dpf larvae (b). N = 7 larvae for stimulated data; N = 5 larvae for control data in both panels; it should be noted that statistics reported in the figure are cumulated over the total number of ROIs segmented over all larvae for each condition: 847,068 (3 dpf stimulated); 588,198 (3 dpf control); 845,070 (5 dpf stimulated); 518,409 (5 dpf control). c Example traces of neurons with spectrally selective responses under standard (top panels) and shuffled (bottom panels) protocol of visual stimulation. The left panels show ΔF/F0 traces of three neurons with a selective L1 response; the right ones show three neurons with selective L4 responses. Stimulus time points are shown at the top (thicker lines highlight the stimulus eliciting the selective response)

Acknowledgments
This image is the copyrighted work of the attributed author or publisher, and ZFIN has permission only to display this image to its users. Additional permissions should be obtained from the applicable author or publisher of the image. Full text @ BMC Biol.