IMAGE

Fig. 3

ID
ZDB-IMAGE-201126-12
Source
Figures for Monroe et al., 2020
Image
Figure Caption

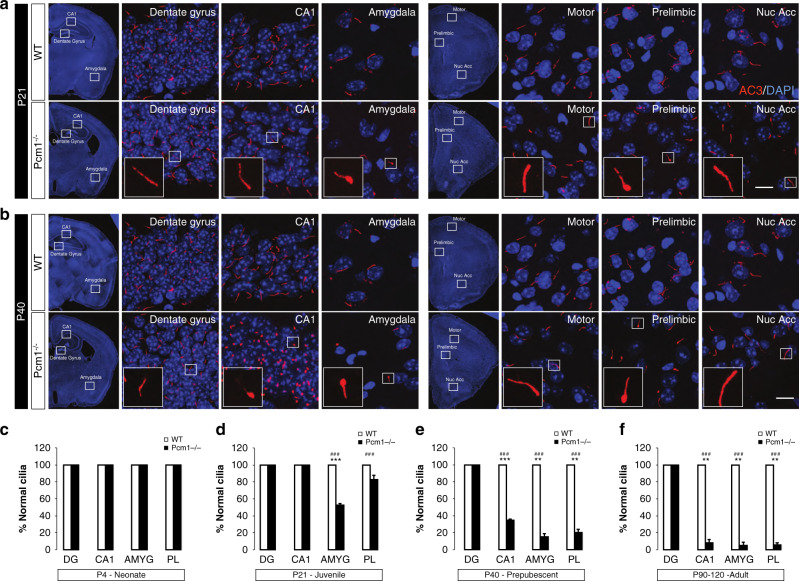
Fig. 3 Temporal and spatial ciliary abnormalities at different ages.

a Coronal brain images revealing bulbous cilia in the prelimbic cortex and amygdala of P21 Pcm1−/− mice. Scale 5 µm (b) At P40, brain regions in the Pcm1−/− mice showing an increased frequency of bulbous cilia. Scale 5 µm (cf) Bar graphs showing the proportion of normal cilia in various brain regions from P4 (c), P21 (d), P40 (e), and P90 (f) in WT and Pcm1−/− mice (cf; N > 30 cilia/region/mouse, 3 mice/genotype; t-test p < 0.001 P21 AMYG; p < 0.001 P21 CA1; p = 0.004 P40 AMYG; p = 0.005 P40 PL; p = 0.004 P90 CA1; p = 0.003 P90 AMYG; p = 0.0012 P90 PL). DG dentate gyrus, AMY amygdala, PL prelimbic cortex. χ2 test, ###p < 0.001; t-tests, mean ± SEM **p < 0.01, ***p < 0.001, WT vs. Pcm1−/−. Source data and detailed statistical information are provided as a Source Data File.

Acknowledgments
This image is the copyrighted work of the attributed author or publisher, and ZFIN has permission only to display this image to its users. Additional permissions should be obtained from the applicable author or publisher of the image. Full text @ Nat. Commun.