
Image
|
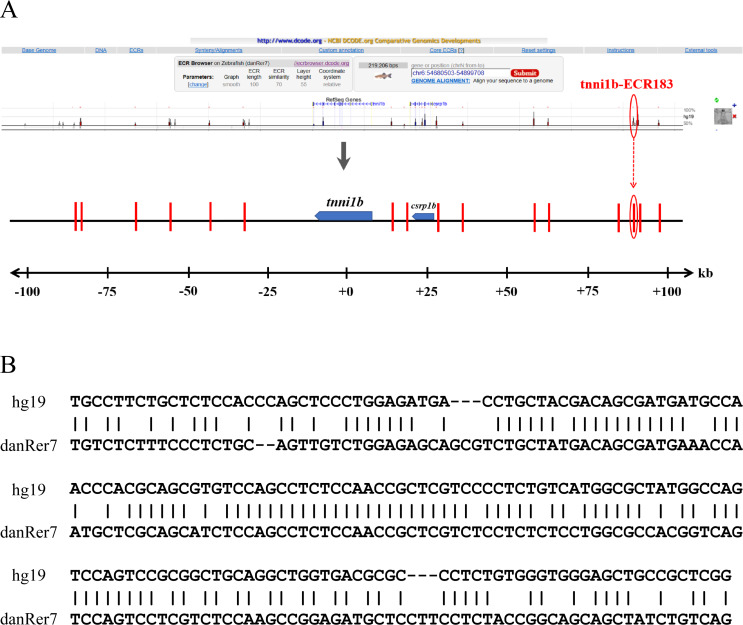
Figure Caption
Figure 2
(A) ECR Browser and parameter set between zebrafish and human genomes around the 219 kb genome range encompassing the
Acknowledgments
This image is the copyrighted work of the attributed author or publisher, and
ZFIN has permission only to display this image to its users.
Additional permissions should be obtained from the applicable author or publisher of the image.
Full text @ Peer J.