IMAGE

Fig. 6

ID
ZDB-IMAGE-201121-30
Source
Figures for Kondrychyn et al., 2020
Image
Figure Caption

Fig. 6 Reassembly of actomyosin network at bleb cortex precedes basal bleb retraction.

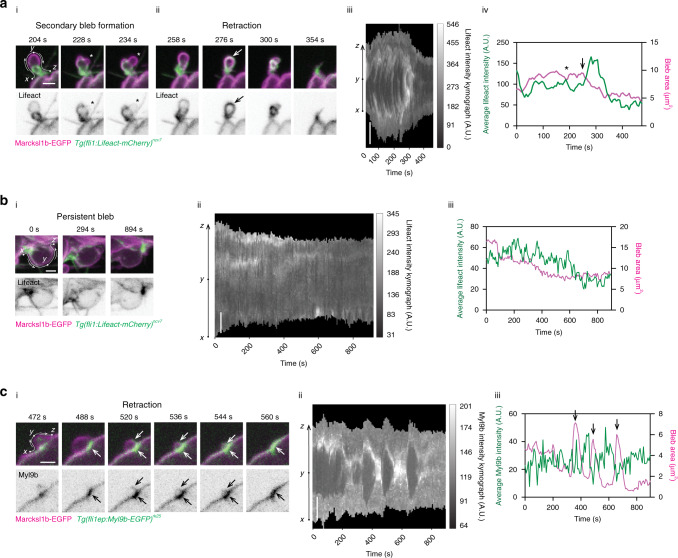
The spatiotemporal dynamics Lifeact (actin, a, b; representative images of 17 embryos from 4 independent experiments; secondary bleb formation was observed in 27/100 blebs, retraction in 52/100 blebs and persistent blebs in 27/100 blebs) and Myl9b (non-muscle myosin II, c representative image of 21 retracting blebs from 5 embryos from 2 independent experiments) at the cortex of Marcksl1b-induced bleb are depicted in time-lapse images (i and ii in a, i in b, c), kymographs (iii in a, ii in b, c) and as an average intensity over time (iv in a, iii in b, c). Negative correlation between actin (a) or non-muscle myosin II (c) intensity and bleb area is observed in retracting blebs while little change in actin intensity is observed in blebs that do not retract (b). *, secondary bleb. Arrow, increase in actin or non-muscle myosin II assembly. Scale bar, 2 µm.

Acknowledgments
This image is the copyrighted work of the attributed author or publisher, and ZFIN has permission only to display this image to its users. Additional permissions should be obtained from the applicable author or publisher of the image. Full text @ Nat. Commun.