
|
Figure 3
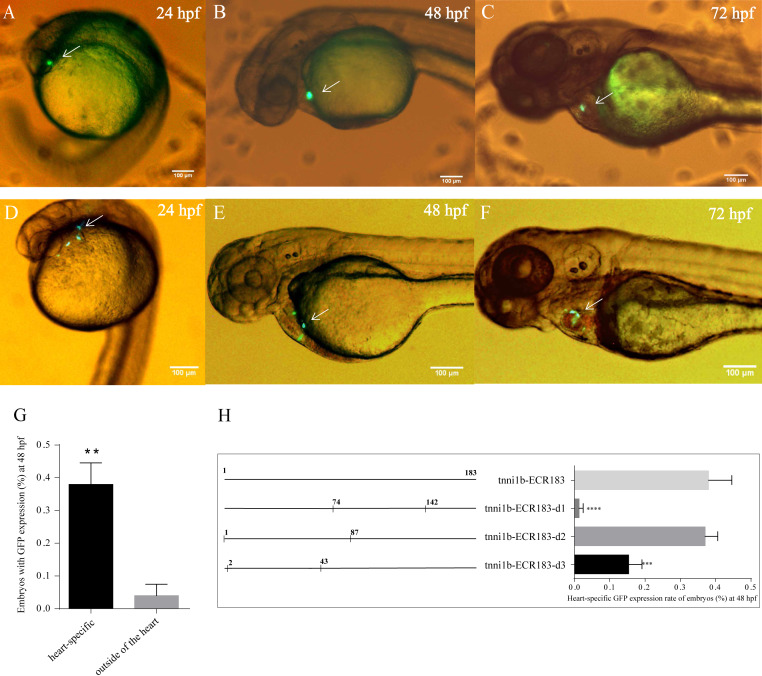
Lateral views of zebrafish embryos with heart-specific GFP expression after injection with tol2 mRNA and tnni1b-ECR183 (A–C) or tnni1b-ECR183-d2 (D–F), scale bars = 100 µm. The average ratios of heart-specific GFP expression embryos to the total surviving embryos were 10/45 (22%) at 24 hpf, 15/41 (37%) at 48 hpf, and 15/39 (38%) at 72 hpf in the tnni1b-ECR183 group and 7/59 (12%) at 24 hpf, 18/48 (38%) at 48 hpf and 16/43 (37%) at 72 hpf in the tnni1b-ECR183-d2 group. (G) Rate of embryos with GFP expression in different tissues at 48 hpf after injection with tnni1b-ECR183. (H) Rate of embryos with heart-specific GFP expression from transient injections of tnni1b-ECR183 and each truncated enhancer with tol2 transposase at 48 hpf. A