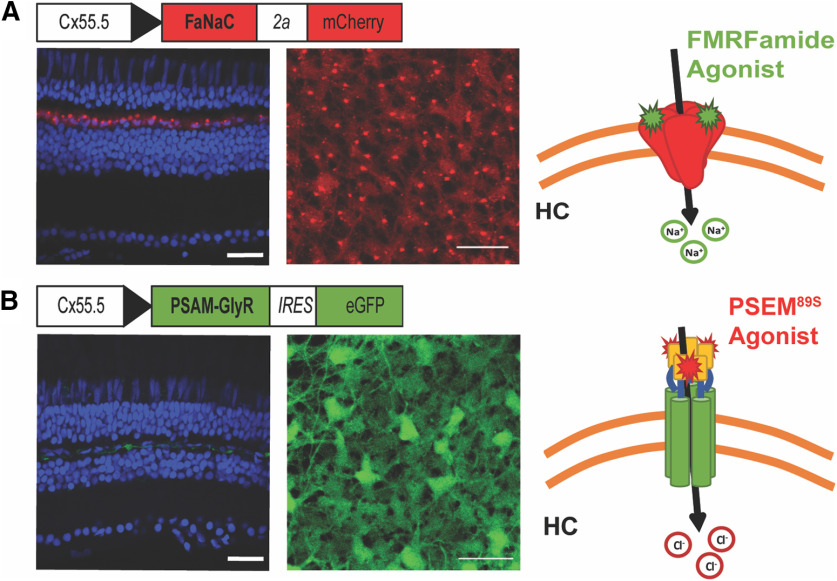
IMAGE

Figure 1.

ID
ZDB-IMAGE-201119-8
Source
Figures for Beckwith-Cohen et al., 2020
Image
Figure Caption

Figure 1.

Strategy for chemogenetic manipulation of HC membrane potential. A, A bicistronic construct containing the molluscan FaNaC from H. aspersa and the red fluorescent protein mCherry, both under the control of the Cx55.5 promoter, were transgenically expressed in HCs of zebrafish causing red fluorescence specific to the HC layer. mCherry exhibits intrinsic fluorescence seen in confocal imaging of a fixed retinal section (left) and in two-photon imaging of a fresh retinal flat mount (right). Puncta with saturating expression of mCherry likely represent protein aggregates within the Golgi apparatus of HCs. A diagram illustrates how binding of the agonist FMRFamide causes Na+ influx thereby depolarizing the membrane potential. B, A bicistronic construct containing the PSAM-GlyR and the green fluorescent protein eGFP, both under the control of the Cx55.5 promoter, were transgenically expressed in HCs of zebrafish causing green fluorescence specific to the HC layer. eGFP was immunolabeled with Alexa Fluor 488 for confocal imaging of a fixed retinal section (left) and its intrinsic fluorescence is seen in two-photon imaging of a fresh retinal flat mount (right). A diagram illustrates how binding of the designer agonist PSEM89S causes Cl influx thereby clamping the membrane potential to ECl. Nuclei are stained with DAPI (blue). Scale bar: 20 μm.

Acknowledgments
This image is the copyrighted work of the attributed author or publisher, and ZFIN has permission only to display this image to its users. Additional permissions should be obtained from the applicable author or publisher of the image. Full text @ eNeuro