
|
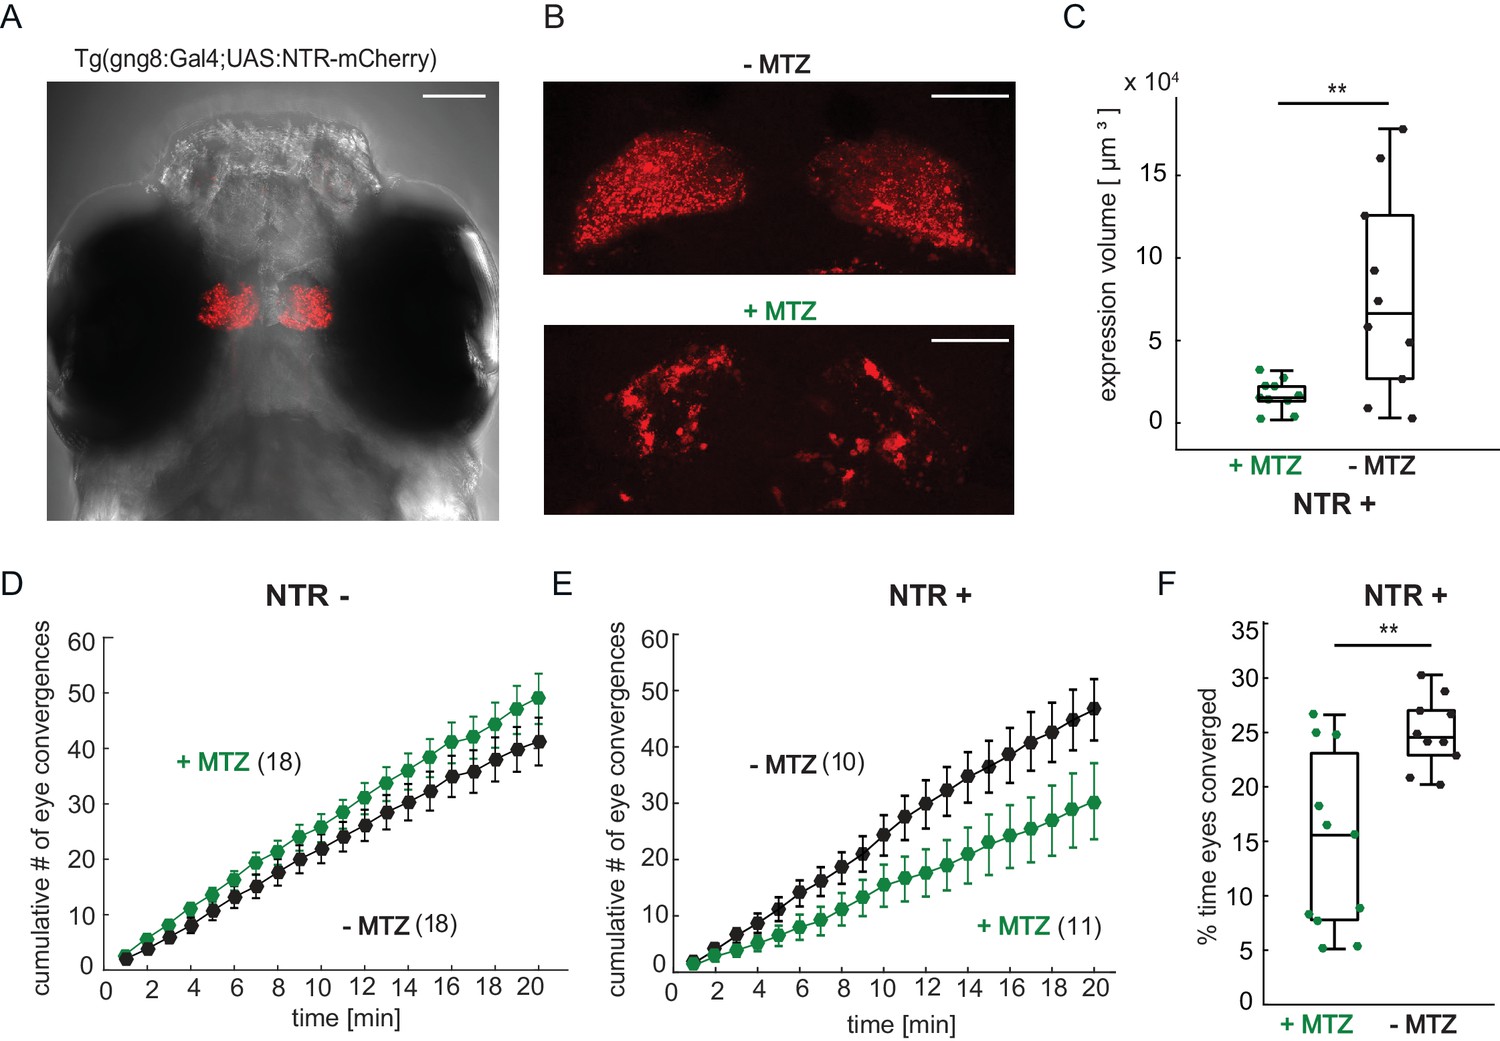
Fig. 7 Chemical disruption of the habenula reduces hunting behavior in prey-experienced fish. (A) Representative image of 7 dpf Tg(gng8:Gal4;UAS:NTR-mCherry) fish, dorsal view. NTR-mCherry is depicted in red, image is a maximum intensity projection of a Z-stack. Additional example image is shown in Figure 7—figure supplement 1C). Scale bar is 100 μm. (B) Representative images of NTR-mCherry expression (red) in the habenula in NTR+ fish after 19 hr in either 0.2% DMSO (-MTZ) (top) or 5 mM MTZ in 0.2% DMSO (+MTZ) (bottom). Images are maximum intensity projections of 5 µm/slice Z-stacks. Scale bar is 40 μm. Additional example images are shown in Figure 7—figure supplement 2A. (C) Volume of NTR-mCherry fluorescence is reduced in NTR-mCherry expressing fish treated with MTZ, p = 0.003, N = 10 animals per group. Differences in signal likely reflect variable transgene expression. Dependence of volume measurement on total fluorescence differs between +MTZ and -MTZ (Figure 7—figure supplement 2B). Symbols indicate individual fish. Box plot shows median, 25th and 75th percentiles. (D, E) Cumulative average number of eye convergences after addition of paramecia in 7 dpf control (NTR-) fish (D) and Tg(gng8:Gal4;UAS:NTR-mCherry) (NTR+) siblings (E), pretreated for 19 hours with either 0.2% DMSO alone (-MTZ) or 0.2% DMSO containing 5 mM metronidazole (+MTZ) and tested for 20 minutes one hour after washout of the drug. Eye convergence rate is reduced in MTZ-treated enzyme expressing fish (NTR+/+MTZ) compared to untreated (NTR+/-MTZ) animals (two-way repeated measures ANOVA shows an effect of treatment with p = 0.033), while we observe no significant difference for NTR- animals (two-way repeated measures ANOVA, effect of treatment p = 0.24). (n) = number of fish in each group. Error bars show SEM. (F) Percent time of eyes converged over 20 min of recording period in NTR+ fish is significantly lower in NTR+/+MTZ fish than in NTR+/-MTZ (p = 0.004. Symbols indicate individual fish. Box plot shows median and 25th and 75th percentiles. A permutation test is used for all pairwise comparisons unless otherwise specified (see Materials and methods, Behavioral data analysis and statistics). Data tables for panels C, D, E, and F in Figure 7—source data 1.