
|
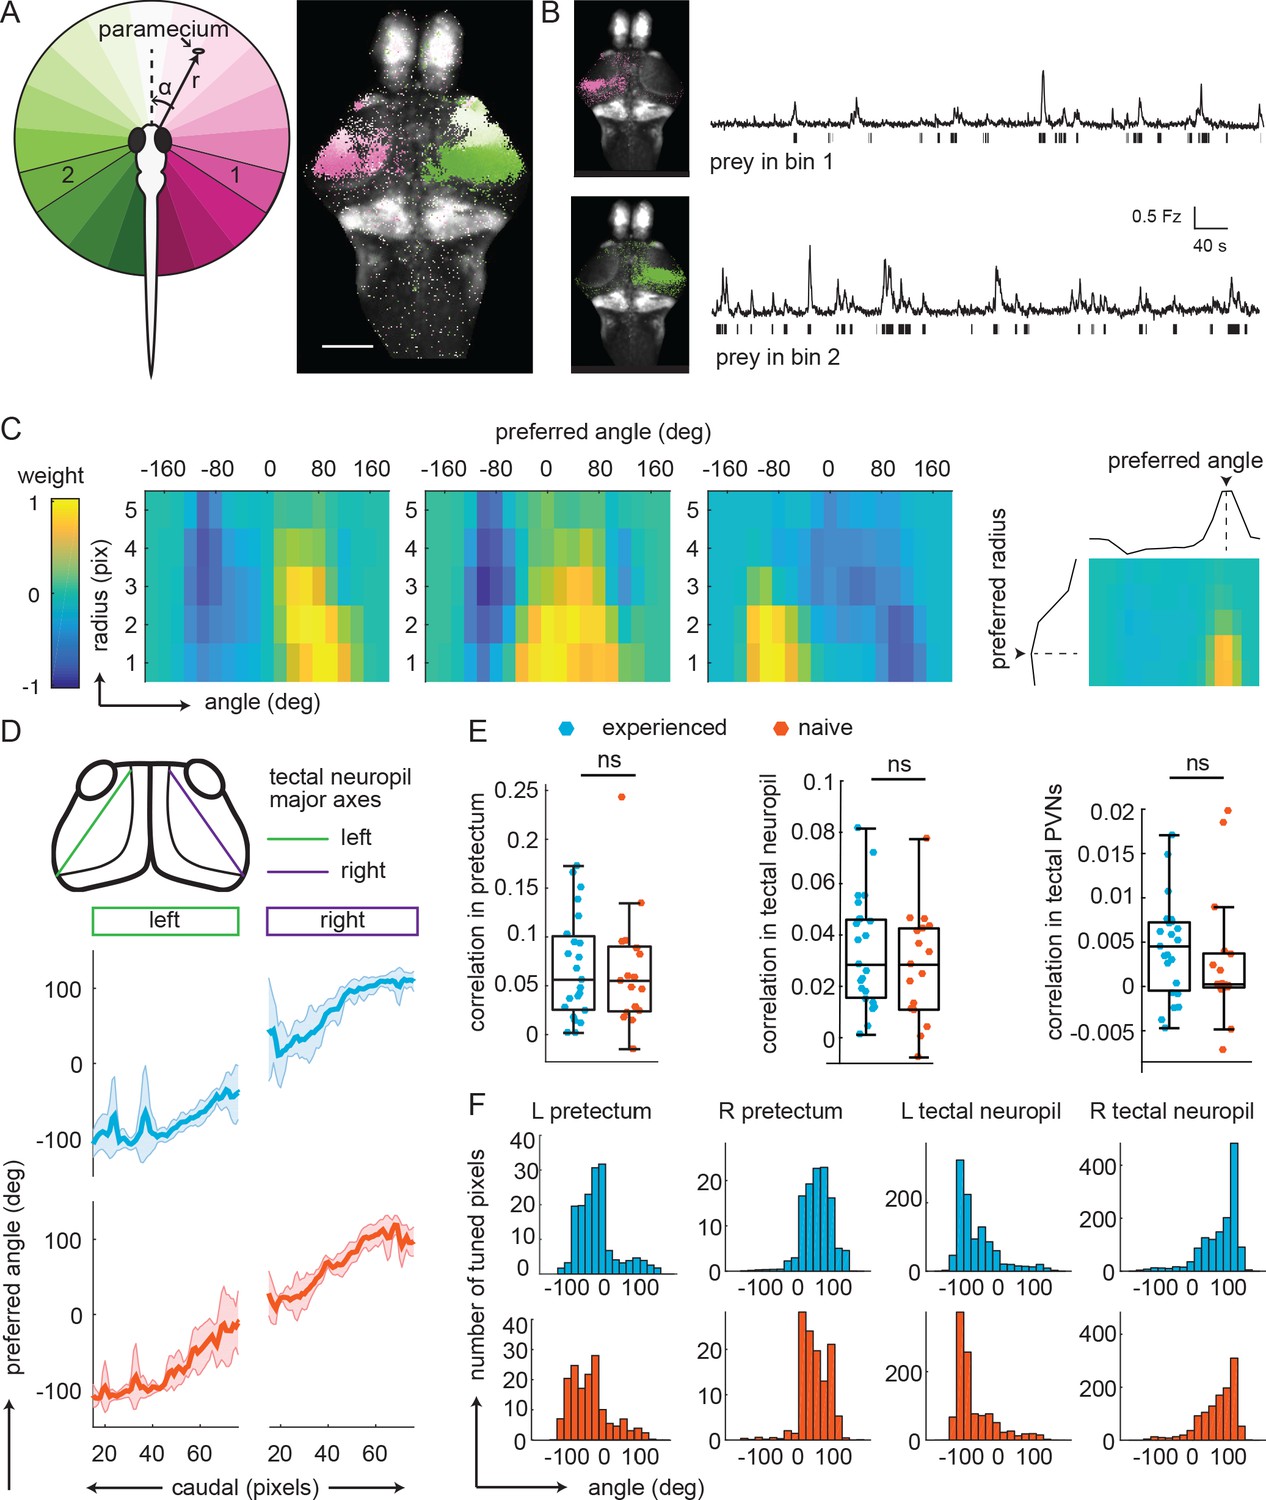
Fig. 3 Experience does not affect prey-associated activity in visual areas. (A) Left, schematic of prey location relative to the fish in polar coordinates (angle α, radius r). Right, example retinotopic map generated by fitting an encoding model for each pixel to predict fluorescence intensity based on prey location. Significantly correlated pixels are in the color of their preferred angle. Scale bar = 200 μm. (B) Average fluorescence from pixels whose preferred angles are in bin 1 (120° to 101°, top) or bin 2 (-104° to 126°, bottom). Left: Anatomical location of pixels. Bars below traces indicate time points when the prey was present in the preferred angle bin. (C) Example angular-radial receptive fields for three pixels in the pretectum. X-axis: angle, y-axis radius; Color represents encoding model weight for that pixel. For each receptive field, color scale is normalized to the maximum weight and centered around 0. Right: preferred angle is max of marginal. (D) Top: anatomical location of tectal neuropil major axes (left: green, right: purple). Middle and Bottom: Average preferred angle gradient along left and right axis, shaded area is standard deviation. Middle: Prey-experienced (N = 23, blue). Bottom: Prey-naïve (N = 19, red). (E) Average correlation values of visual area pixels in pretectum (left), tectal neuropil (middle), and tectal PVNs (right) were not significantly different between prey-experienced (N = 23) and prey-naïve fish (N = 17), p = 0.80 for pretectum; p = 0.42. (F) Average distribution of pixels’ preferred angles in each area (columns) in prey-experienced (blue, top row) and prey-naïve (red, bottom row) fish. There were no differences in average preferred angle distributions between the two groups of fish (two-sample Kolmogorov-Smirnov tests, p = 0.93 for pretectum, p = 0.94 for tectal neuropil and p = 0.95 for tectal PVNs.). See also Figure 3—figure supplement 1. A permutation test was used for all pairwise comparisons if not specified otherwise (see Materials and methods, Behavioral data analysis and statistics). Data tables for panels B, C, D, E, and F in Figure 3—source data 1.