
|
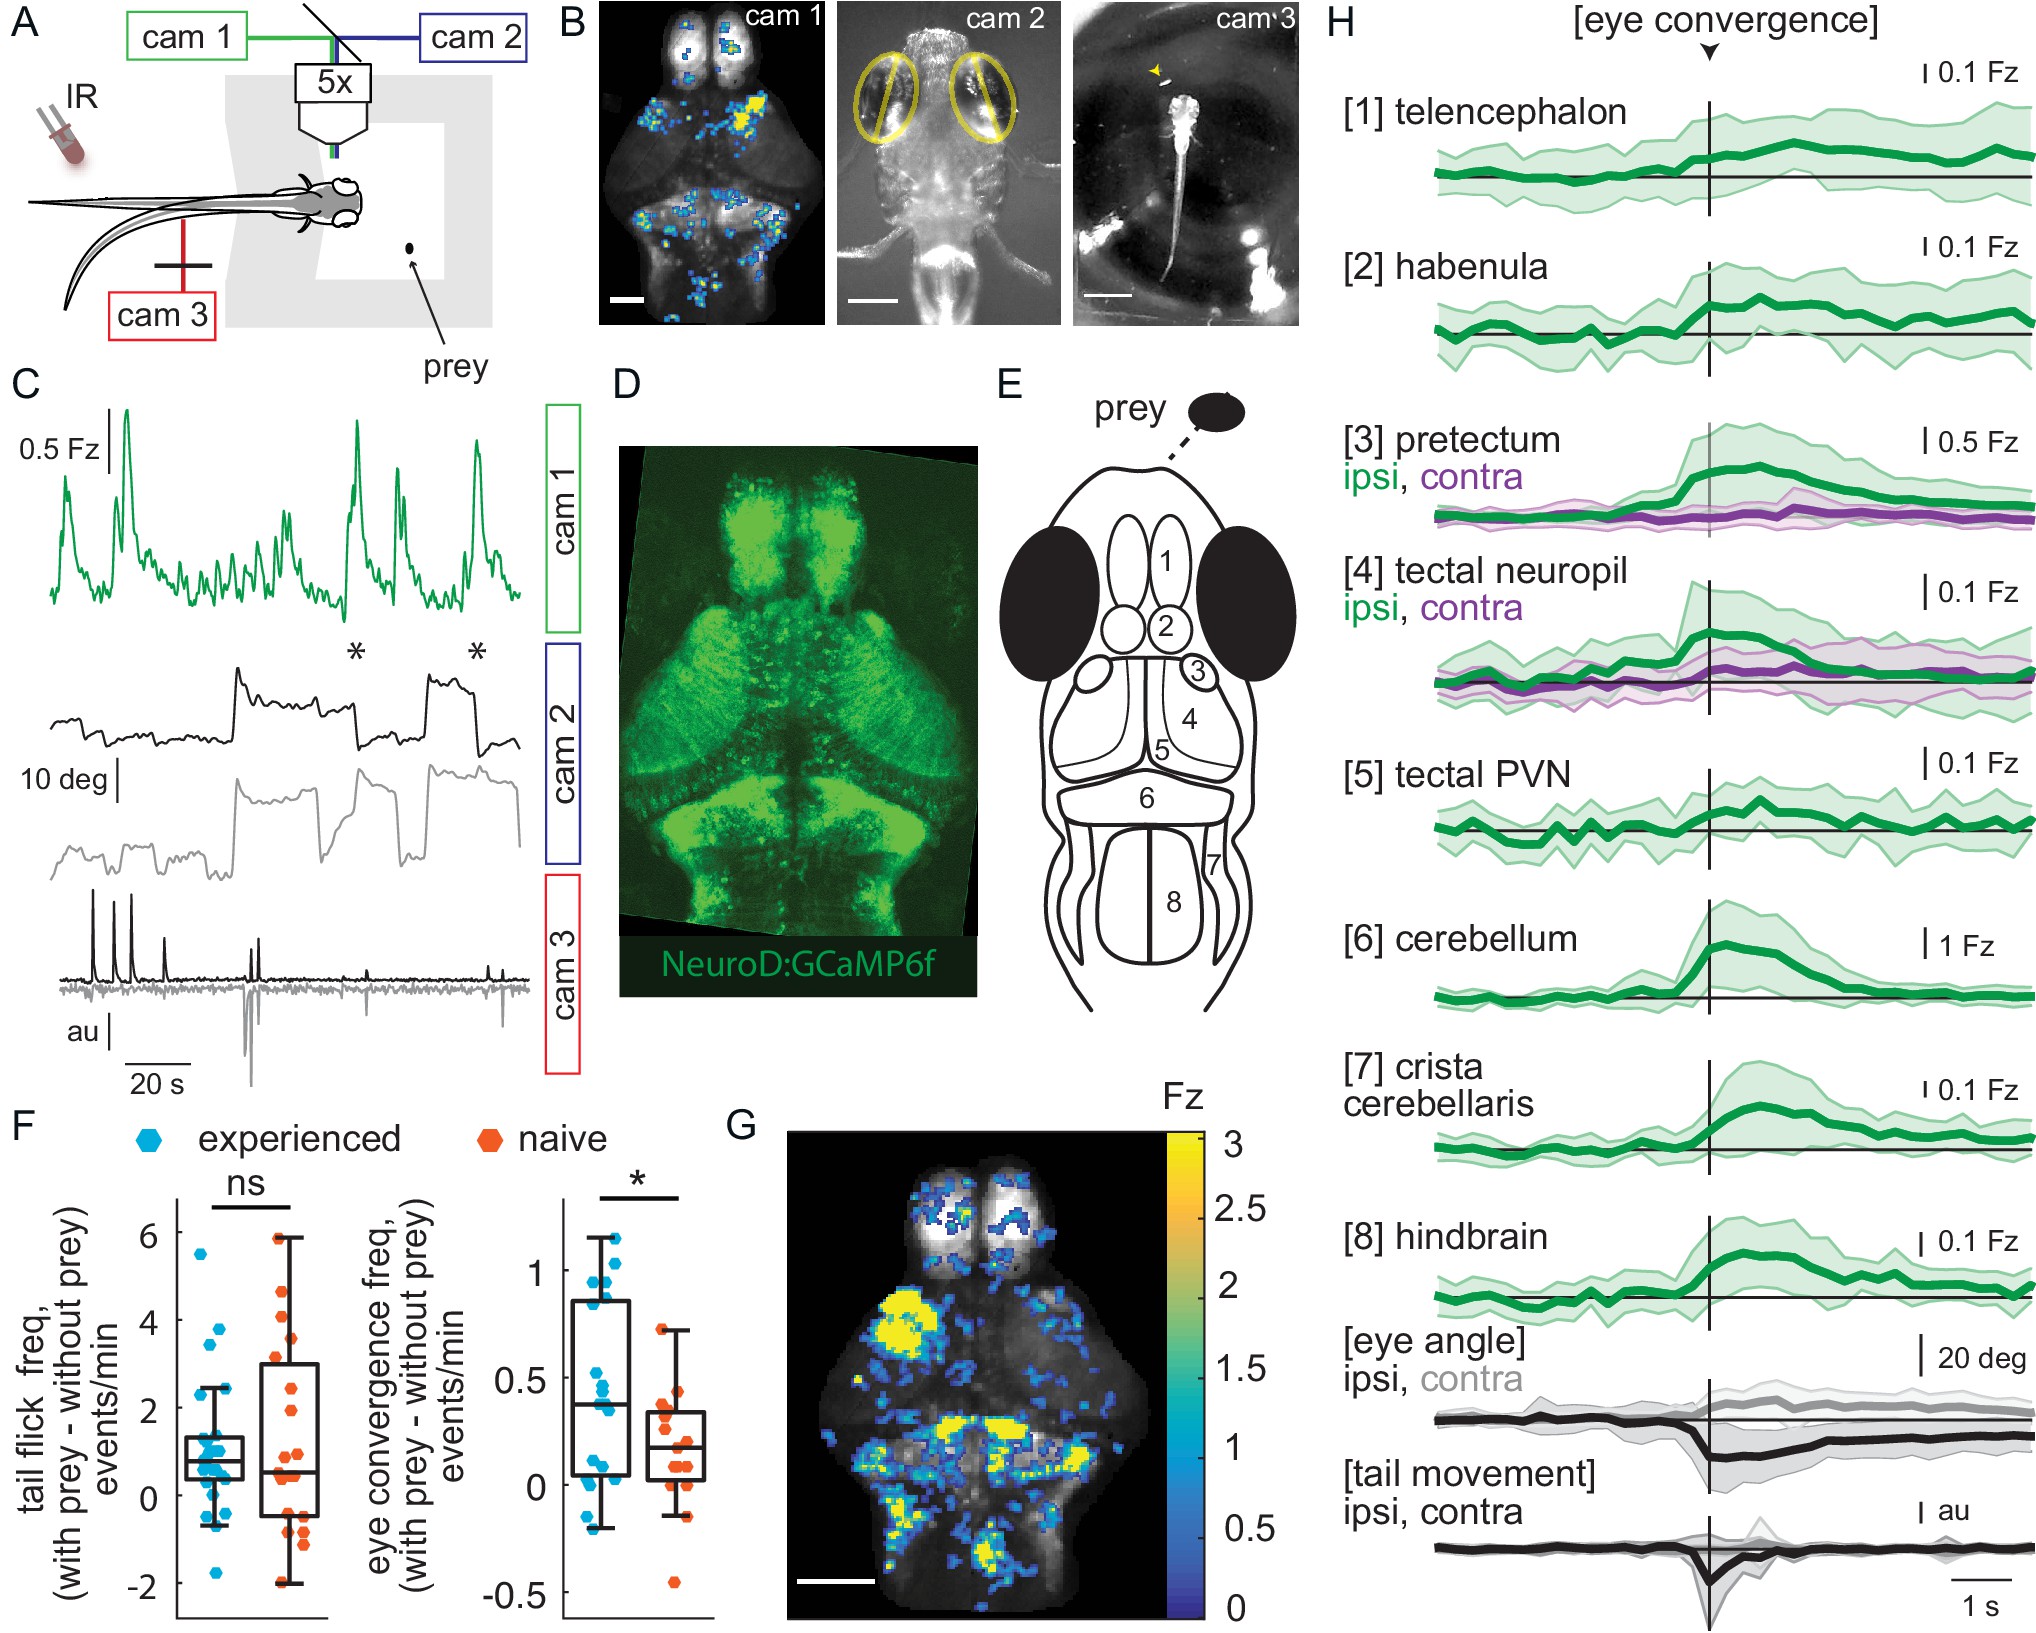
Fig. 2 Wide-field brain imaging of prey capture initiation shows recruitment of visual and motor areas, as well as the telencephalon and habenula. (A, B) Setup for imaging of neural activity in a single plane of the whole brain while the fish observes prey (A) and example frames captured by three cameras (B). Camera 1 (cam 1): neural activity in a single plane of the whole brain while the fish observes prey, scale bar = 200 μm. Camera 2 (cam 2): eye angle, scale bar = 200 μm. Camera 3 (cam 3): prey position and fish tail position, scale bar = 1 mm. Cameras were synchronized at 3.6 Hz. (C) Example 3 min traces from one fish for all three cameras illustrating data collected during eye convergences. Cam 1: Z-scored fluorescence in the right pretectum (smoothed with a Lowess filter, span = 7, for Fz calculation see Materials and methods, Calcium and behavior imaging data pre-processing). Cam2: Corresponding eye angles (left eye, gray; right eye, black; convergence events, stars; smoothed with a Lowess filter, span = 9). Cam 3: tail movement (left side, gray; right side, black, see Materials and methods). (D) Tg(NeuroD:GCaMP6f) 7 dpf fish brain, dorsal view as imaged by cam 1. (E) Schematic of anatomy in observation plane, numbered areas as defined in (H). (F) Prey-experienced and prey-naïve fish have statistically indistinguishable evoked (with prey – without prey) frequency of tail flicks (left, p = 0.74), but prey-experienced fish have a significantly higher eye convergence frequency (right, with prey – without prey, p = 0.04). (G, H) Neural activity in a prey-experienced fish around eye convergences with prey (N = 12 eye convergences). This fish showed no spontaneous eye convergences preceding addition of paramecium, suggesting that averaged activity was purely evoked by the paramecium. ‘Contra’ and ‘ipsi’ refer to the side with higher or lower pretectal transient amplitude peak time (see Materials and methods). (G) Spatial distribution of summed calcium activity over 4.2 s (five frames before to 10 frames after eye convergence), when the prey was to the right side of the fish (average of six convergences). Scale bar = 100 μm. Fz thresholded for visualization. (H) Time-course of calcium activity for each brain area in an example experienced fish (average of 12 convergences; convergence time is vertical black line) over a period of 10 seconds. We observe a significant increase in fluorescence for all brain areas except the ipsilateral side of the pretectum, comparing average fluorescence traces of baseline (frames −10 to −5 before eye convergence), to the five frames after eye convergence (black line in the figure). P-values are reported in Supplementary file 1. For eye angle and tail movement, black is contralateral, and gray is ipsilateral. See also Figure 2—figure supplement 1, and movies in Figure 2—video 1 and Figure 2—video 2. A permutation test was used for all pairwise comparisons if not specified otherwise (see Materials and methods, Behavioral data analysis and statistics). Data tables for panels F and H in Figure 2—source data 1.