
Image
|
Figure Caption
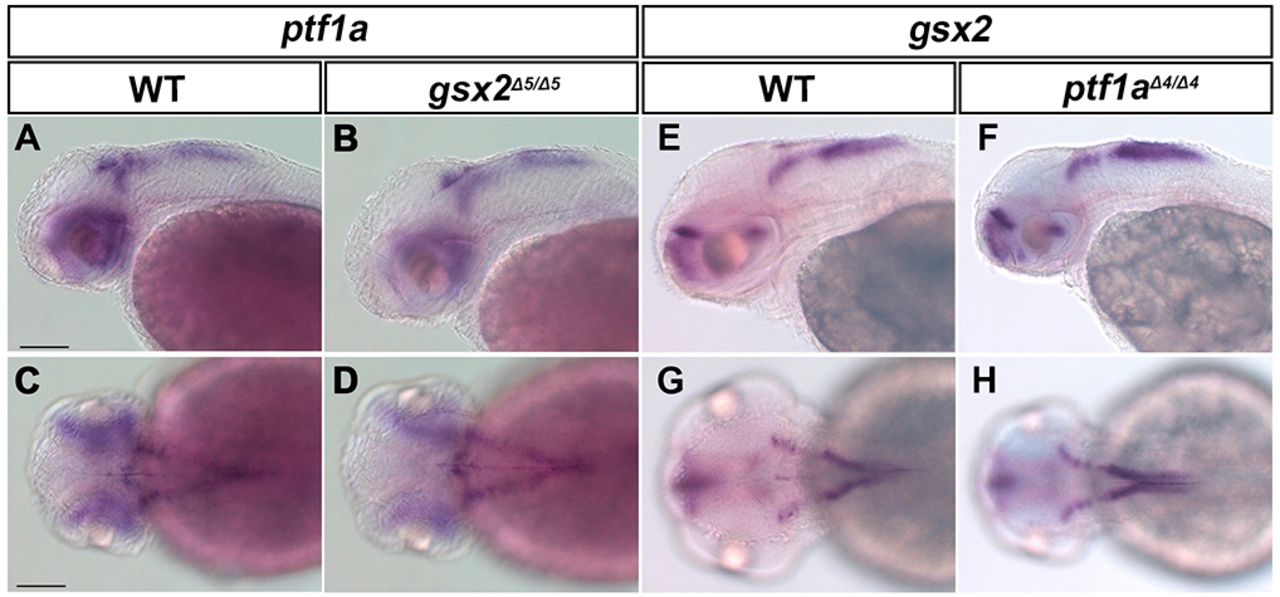
Fig. 4 Expression of ptf1a and gsx2 was not affected in gsx2 and ptf1a mutants. (A-D) Expression of ptf1a in 2-dpf wild-type (A,C, n=2) and gsx2 mutant (B,D, n=4) larvae. (E-H) Expression of gsx2 in 2 dpf wild-type (E,G, n=2) and ptf1a mutant (F,H, n=3) larvae. Scale bars: 100 µm in A (applies to A,B,E,F) and C (applies to C,D,G,H).
Figure Data
Acknowledgments
This image is the copyrighted work of the attributed author or publisher, and
ZFIN has permission only to display this image to its users.
Additional permissions should be obtained from the applicable author or publisher of the image.
Full text @ Development