
|
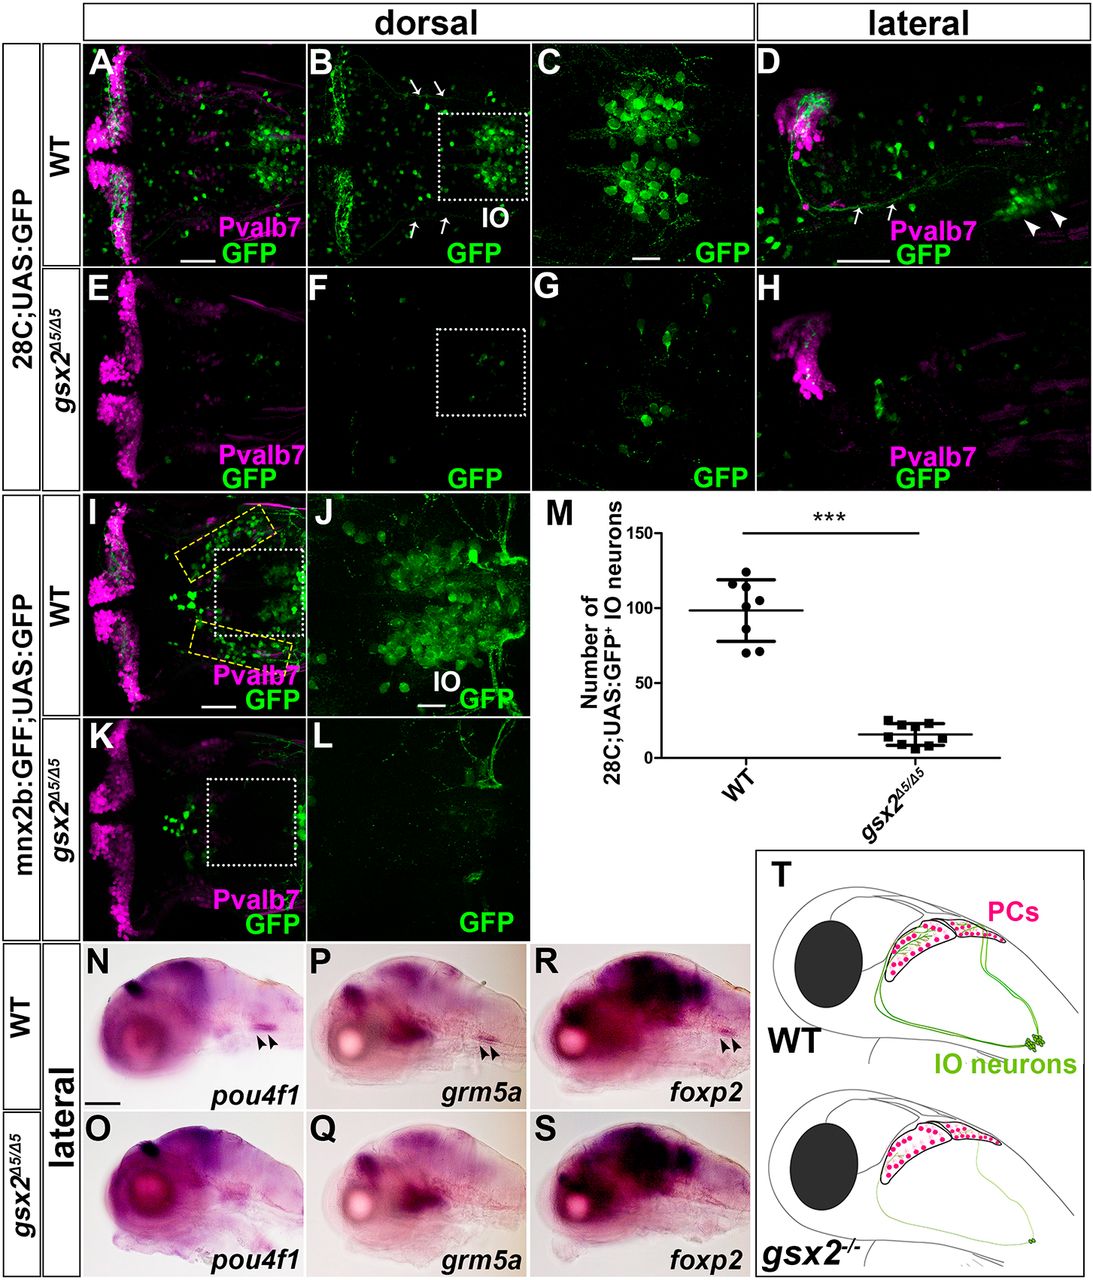
Fig. 2 Strong reduction or loss of IO neurons in gsx2 mutants. (A-H) 5 dpf wild-type (A-D, n=10) and gsx2Δ5/Δ5 (E-H, n=10) hspGFFDMC28C;UAS:GFP (28C;UAS:GFP) larvae immunostained using anti-Pvalb7 (magenta) and anti-GFP (green) antibodies. Arrows and arrowheads indicate CFs and IO neurons, respectively. (C,G) Higher magnification of the boxes in B and F. (I-L) 5 dpf wild-type (I,J, n=6) and gsx2Δ5/Δ5 (K,L, n=7) mnx2b:GFF;UAS:GFP larvae. GFP+ cells in the yellow dotted boxes were fewer or absent in gsx2Δ5/Δ5 larvae. (J,L) Higher magnification of the boxes in I and K. (M) Number of 28C;UAS:GFP+ IO neurons in wild-type and gsx2Δ5/Δ5 larvae. 28C;UAS:GFP+ IO neurons were significantly fewer in gsx2 mutant larvae compared with control larvae. ***P<0.001 (Student's t-test). Data are mean±s.e.m. with individual values indicated. (N-S) Expression of endogenous IO neuronal markers in wild type and gsx2Δ5/Δ5. (N,O) Expression of pou4f1 in wild type (n=4) and gsx2Δ5/Δ5 (n=4). (P,Q) Expression of grm5a in wild type (n=3) and gsx2Δ5/Δ5 (n=2). (R,S) Expression of foxp2 in wild type (n=5) and gsx2Δ5/Δ5 (n=5). (T) Illustration of PCs and IO neurons in wild-type and gsx2 mutant larvae. Scale bars: 100 µm in N (applies to N-S); 50 µm in A (applies to A,B,E,F), D (applies to D,H) and I (applies to I,K); 20 µm in C (applies to C,G) and J (applies to J,L).