
|
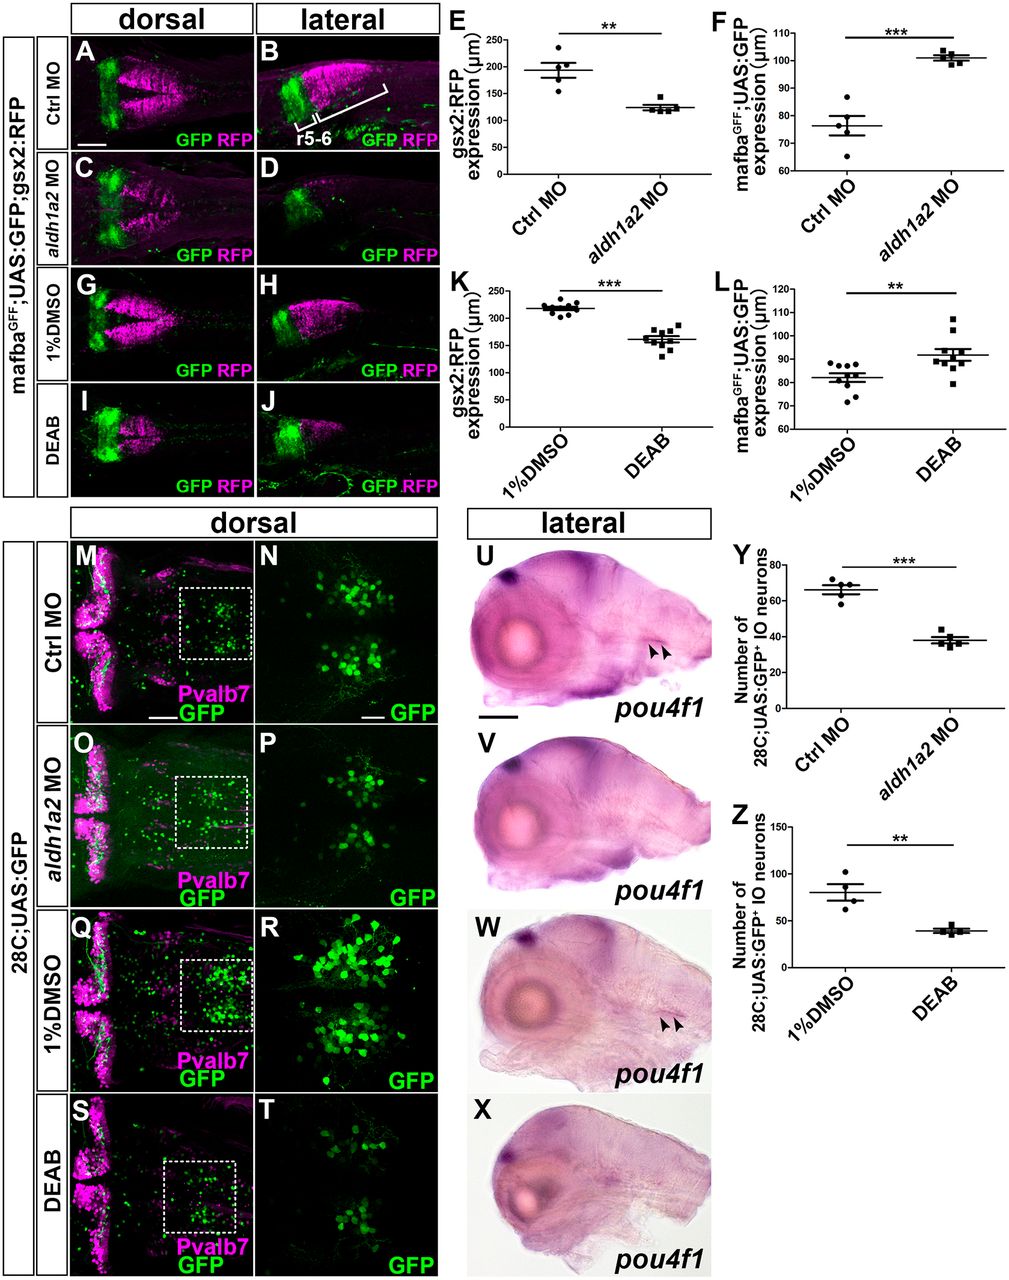
Fig. 9 RA signal positively controls gsx2 expression and IO neuronal development. (A-D) 3 dpf control morphant (A,B, n=5) and aldh1a2 morphant (C,D, n=5) mafbaGFF;UAS;GFP;gsx2:RFP larvae were stained using anti-RFP (magenta) and anti-GFP (green) antibodies. (E,F) Extent of gsx2:RFP (E) and mafbaGFF;UAS:GFP expression (F) in the hindbrain of the control and aldh1a2 morphants. (G-J) mafbaGFF;UAS;GFP;gsx2:RFP larvae were treated with 1% DMSO (G,H, n=10) and 0.25 µM DEAB (I,J,H,I, n=10) from 6 to 22 hpf, fixed at 3 dpf, and stained using anti-GFP and anti-RFP antibodies. (K,L) Extent of gsx2:RFP (K) and mafbaGFF;UAS:GFP (L) expression in the hindbrain of larvae treated with DMSO or DEAB. (M-T) 5 dpf control morphant (M,N, n=5) and aldh1a2 morphant (O,P, n=5), DMSO- (Q,R, n=4) or DEAB-treated (S,T, n=4) 28C;UAS:GFP larvae were stained using anti-Pvalb7 (magenta) and anti-GFP (green) antibodies. (N,P,R,T) Higher magnification of the boxes in M,O,Q,S. (U-X) Expression of pou4f1 in 5 dpf control morphant (n=5), aldh1a2 morphant (n=5), DMSO-treated (n=3) or DEAB-treated (n=3) larvae. (Y) The number of 28C;UAS:GFP+ IO neurons in 5 dpf control morphant and aldh1a2 morphant larvae. (Z) Number of 28C;UAS:GFP+ IO neurons in 5 dpf larvae treated with DMSO and DEAB. **P<0.01; ***P<0.001 (Student's t-test). Data are mean±s.e.m. with individual values indicated. Scale bars: 100 µm in A (applies to A-D,G-J) and U (applies to U-X); 50 µm in M (applies to M,O,Q,S); 20 µm in N (applies to N,P,R,T).