
|
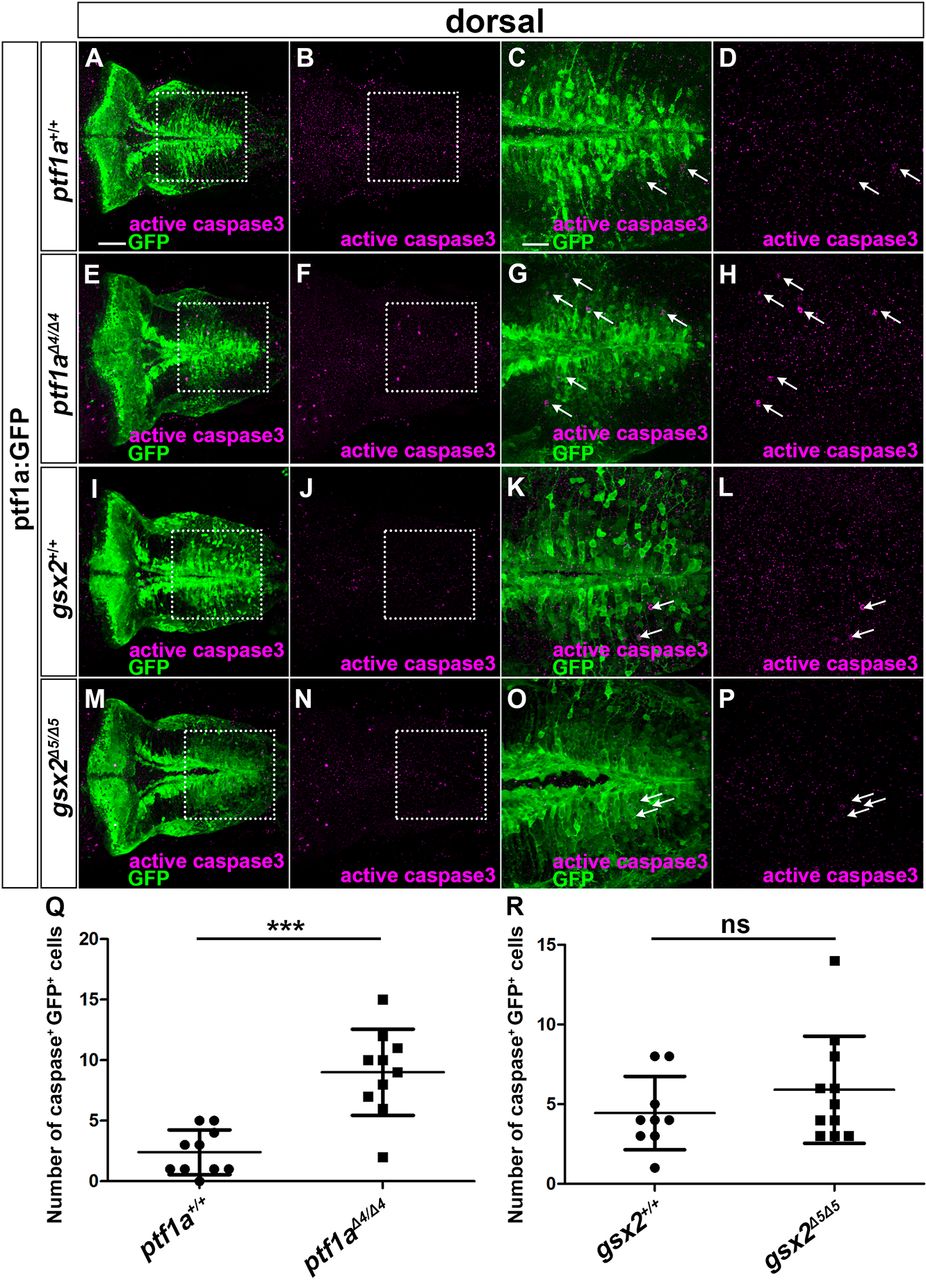
Fig. 5 Apoptosis occurs in ptf1a but not gsx2 mutants. (A-P) 5 dpf ptf1a+/+ (A-D, n=10), ptf1aΔ4/Δ4 (E-H, n=10), gsx2+/+ (I-L, n=9) and gsx2Δ5/Δ5 (M-P, n=11) ptf1a:GFP larvae were stained using anti-GFP (green) and anti-cleaved caspase 3 (magenta) antibodies. (C,G,K,O) Higher magnification of the boxes in A,E,I,M. (D,H,L,P) Higher magnification of the boxes in B,F,J,N. Arrows indicate both GFP+ and cleaved caspase 3+ cells. (Q,R) Number of GFP+ and cleaved caspase 3+ cells in the caudal hindbrain in wild type, and the ptf1a and gsx2 mutants. ns, not significant; ***P<0.001 (Student's t-test for Q,R). Data are mean±s.e.m. with individual values indicated. Scale bars: 50 µm in A (applies to A,B,E,F,I,J,M,N); 20 µm in C (applies to C,D,G,H,K,L,O,P).