IMAGE

Fig 8

ID
ZDB-IMAGE-201107-10
Genes
Source
Figures for Diofano et al., 2020
Image
Figure Caption

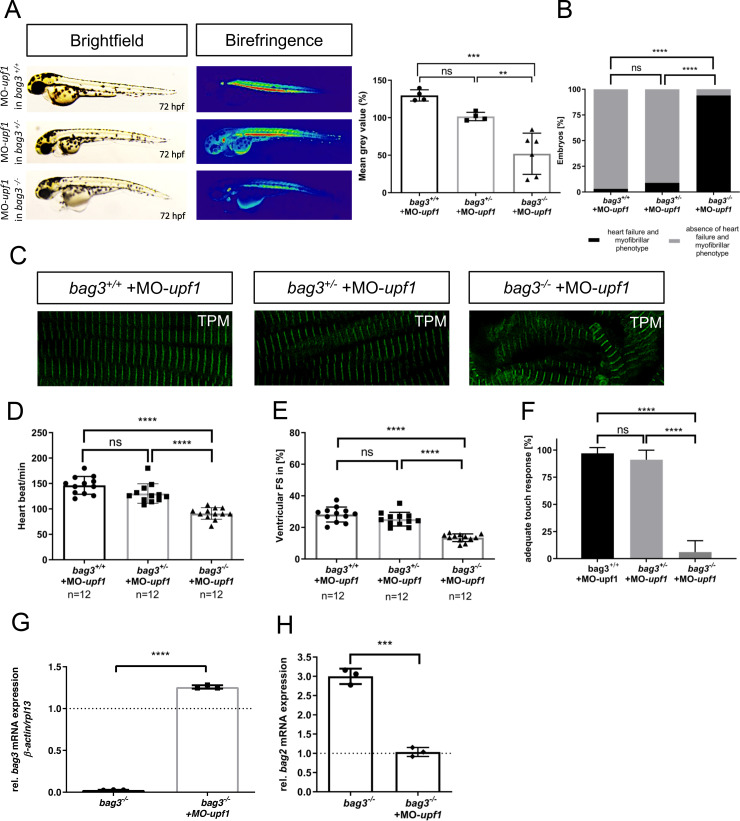
Fig 8 Knockdown of <italic>upf1</italic> blocks mutant mRNA decay required for transcriptional adaptation in <italic>bag3<sup>-/-</sup></italic> mutants.

(A) Brightfield and birefringence images and densitometric analysis of birefringence (n = 4/6) of bag3+/+, bag3+/- and bag3-/- embryos at 72 hpf injected with 50μM MO-upf1. Individual samples are shown (One-way ANOVA followed by tukey's multiple comparison analysis, **P=0.0053, ***P=0.0002). (B)bag3-/- embryos injected with MO-upf1 develop (cardio-)myopathy (93.94±10.50%), whereas bag3+/+ (96.97±5.25%) and bag3+/- (91.09±8.82%) embryos are devoid of any phenotype (N = 3, n = 40, mean ± S.D., P<0.0001, two-tailed value for Fisher´s exact test). (C) Tropomyosin immunostainings of bag3+/+, bag3+/- and bag3-/- embryos injected with MO-upf1 at 72 hpf reveal muscle fiber disruptions due to the blockage of the transcriptional adaptation only in bag3-/- injected embryos. (D) Heart rate quantification at 72 hpf reveals impairments only in bag3-/- embryos injected with MO-upf1 (N = 3, n = 12, HR bag3+/+: 146±17.49 heart beat/min; HR bag3+/-: 130±19.18 heart beat/min; HR bag3-/-: 91±11.39 heart beat/min, mean ± S.D. One-way ANOVA followed by tukey's multiple comparison analysis, P<0.0001). (E) FS of ventricles of bag3-/- embryos injected with MO-upf1 is significantly reduced at 72 hpf (FS: 13.48±2.438%) compared to the FS measured in bag3+/+ (FS: 28.17±4.753%) and bag3+/- (FS: 25.23±4.328%) morphants (N = 3, n = 12; mean± SD One-way ANOVA followed by tukey's multiple comparison analysis, P<0.0001). (F)bag3-/- embryos injected with MO-upf1 (6.06±10.5%) reveal significant difference in responsiveness upon mechanical stimulus compared to bag3+/+(96.97±5.25%) and bag3+/- (91.09±8.82%) injected embryos (N = 3, n = 35, mean ± S.D. One-way ANOVA followed by tukey's multiple comparison analysis, P<0.0001). (G) Quantitative real-time PCR of bag3-/- +MO-upf1 and bag3-/- zebrafish embryos at 72 hpf shows restored bag3 mRNA levels only in bag3-/- embryos injected with MO-upf1 (N = 3, mean ± SD, P<0.0001 determined using two-tailed t-test). (H) Quantitative real-time PCR of bag3-/- embryos injected with MO-upf1and uninjected bag3-/- control embryos at 72 hpf reveals the downregulation of bag2 mRNA levels only in bag3-/- + MO-upf1 embryos (N = 3, mean ± SD, P = 0.0004 determined using two-tailed t-test).

Figure Data
Acknowledgments
This image is the copyrighted work of the attributed author or publisher, and ZFIN has permission only to display this image to its users. Additional permissions should be obtained from the applicable author or publisher of the image. Full text @ PLoS Genet.