
Image
|
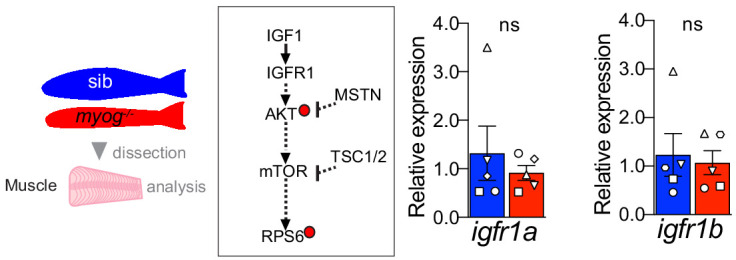
Figure Caption
Figure 3
Schematic of adult trunk muscle processing for qPCR analysis (left). Summary of mTORC1 pathway with analysed members, positive (arrows) or negative (bars) effects are indicated (centre). Dashed lines indicate other molecules involved, plain arrow indicate direct effect, red dots represent phosphorylation.
Acknowledgments
This image is the copyrighted work of the attributed author or publisher, and
ZFIN has permission only to display this image to its users.
Additional permissions should be obtained from the applicable author or publisher of the image.
Full text @ Elife