IMAGE

Fig. 3.

ID
ZDB-IMAGE-201102-8
Antibodies
Source
Figures for Jewett et al., 2020
Image
Figure Caption

Fig. 3.

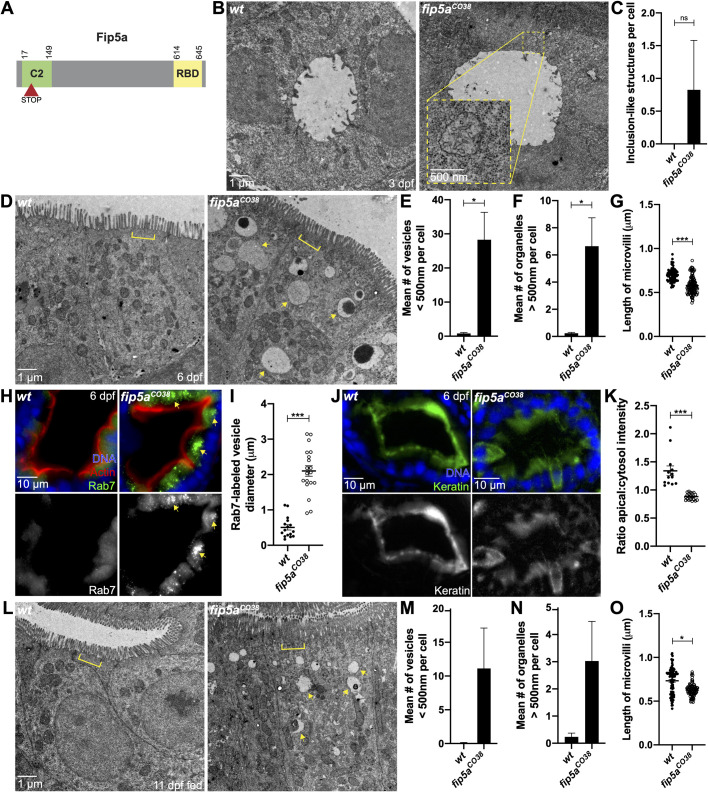
fip5a functions similarly to fib5b in endosome maturation and terminal web organization. (A) Domain schematic of zebrafish Fip5a protein containing a C2 domain at the N-terminus and a Rab-binding domain (RBD) at the C-terminus. The red arrowhead with STOP denotes premature termination codon in fip5a mutant alleles. All following images are representative cross sections through midgut region. Wild-type siblings are used as controls. For all experiments, three separate animals for each condition were analyzed. (B) Electron micrographs showing 3 dpf wild-type and fip5aCO38 mutant larvae. Yellow box shows zoomed in view on a region with subapical structures resembling microvillus inclusions. (C) Quantitation of the mean number of microvillus inclusion-like structures per cell in 3 dpf wild-type and fip5aCO38 mutant larvae. (D) Electron micrographs showing 6 dpf wild-type and fip5aCO38 mutant larvae. Arrows point to larger than 500 nm organelles and brackets mark terminal web or lack thereof in mutants. (E) Quantitation of less than 500 nm apical vesicles in 6 dpf larvae. (F) Quantitation of greater than 500 nm organelles in 6 dpf larvae. (G) Quantitation midgut microvilli length in 6 dpf larvae. Each dot represents a single microvillus length combined across three animals. (H) Immunohistochemistry on cross sections of 6 dpf wild-type and fip5aCO38 mutant larvae stained with Hoechst (blue), Phalloidin (red), and Rab7 (green). (I) Quantitation of Rab7-vesicle diameter. (J) Immunohistochemistry on cross sections of 6 dpf wild-type and fip5aCO38 mutant larvae stained with Hoechst (blue) and Cytokeratin (green). (K) Ratio of fluorescence intensity of apical keratin to cytoplasmic keratin. (L) Electron micrographs showing 11 dpf fed wild-type and fip5aCO38 mutant larvae. Arrows point to larger than 500 nm organelles and brackets mark terminal web or lack thereof in mutants. (M) Quantitation of less than 500 nm apical vesicles in 11 dpf larvae. (N) Quantitation of greater than 500 nm organelles in 11 dpf larvae. (O) Quantitation midgut microvilli length in 11 dpf larvae. Each dot represents a single microvillus length combined across three animals. All plots show mean±s.e.m. A t-test was used for Gaussian data and a Mann–Whitney test for all other statistics. ***P<0.0005, *P<0.05.

Figure Data
Acknowledgments
This image is the copyrighted work of the attributed author or publisher, and ZFIN has permission only to display this image to its users. Additional permissions should be obtained from the applicable author or publisher of the image. Full text @ Biol. Open