IMAGE

Figure 7

ID
ZDB-IMAGE-201102-17
Genes
Antibodies
Source
Figures for Santhanam et al., 2020
Image
Figure Caption

Figure 7

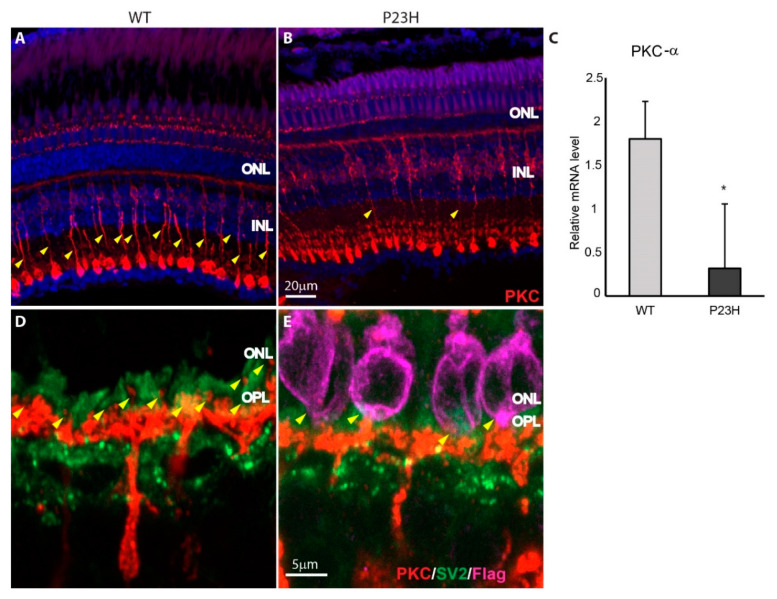
Bipolar cell synapses in P23H transgenic retina. (A,B) Immunolabeling for PKC-α (red) shows that rod bipolar cells are morphologically similar, but PKC-α labeling is less intense in the P23H transgenic (B) compared to WT (A). Yellow arrowheads indicate the bipolar cell axons. (C) Relative mRNA level of PKC-α is higher in the WT compared to the P23H (n = 3 fish per genotype; error bars are ± SD; * p < 0.05). (D,E) Enlarged images show the synaptic contacts made by PKC-labeled bipolar cells with rod and cone photoreceptor terminals labeled for SV2 (green). Fine synaptic contacts onto rods are shown with yellow arrowheads. Bipolar cells appear to contact some of the rods expressing the P23H rhodopsin (magenta) (E). ONL: outer nuclear layer; INL: inner nuclear layer; OPL: outer plexiform layer.

Figure Data
Acknowledgments
This image is the copyrighted work of the attributed author or publisher, and ZFIN has permission only to display this image to its users. Additional permissions should be obtained from the applicable author or publisher of the image. Full text @ Cells