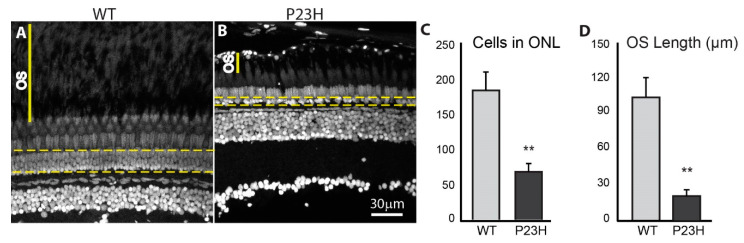
IMAGE

Figure 4

ID
ZDB-IMAGE-201102-15
Source
Figures for Santhanam et al., 2020
Image
Figure Caption

Figure 4

Photoreceptor loss in the P23H transgenic zebrafish. DAPI label of adult retina sections. The yellow dotted lines encompass nuclei in the ONL counted to assess photoreceptor loss. OS indicates the space between photoreceptor myoids and retinal pigmented epithelium. The number of cells in the ONL is almost three times greater in the WT (A) than in the P23H mutant (B), which usually shows a single irregular layer of nuclei. (C) Quantification of photoreceptor counts in WT and P23H transgenic (n = 6 fish per genotype; error bars are ± SD; ** p < 0.01). (D) Quantification of OS length in WT and P23H transgenic (n = 6 fish per genotype; error bars are ± SD; ** p < 0.01). Scale bar in B applies to A and B.

Figure Data
Acknowledgments
This image is the copyrighted work of the attributed author or publisher, and ZFIN has permission only to display this image to its users. Additional permissions should be obtained from the applicable author or publisher of the image. Full text @ Cells