IMAGE

Fig. 5.

ID
ZDB-IMAGE-201102-11
Source
Figures for Jewett et al., 2020
Image
Figure Caption

Fig. 5.

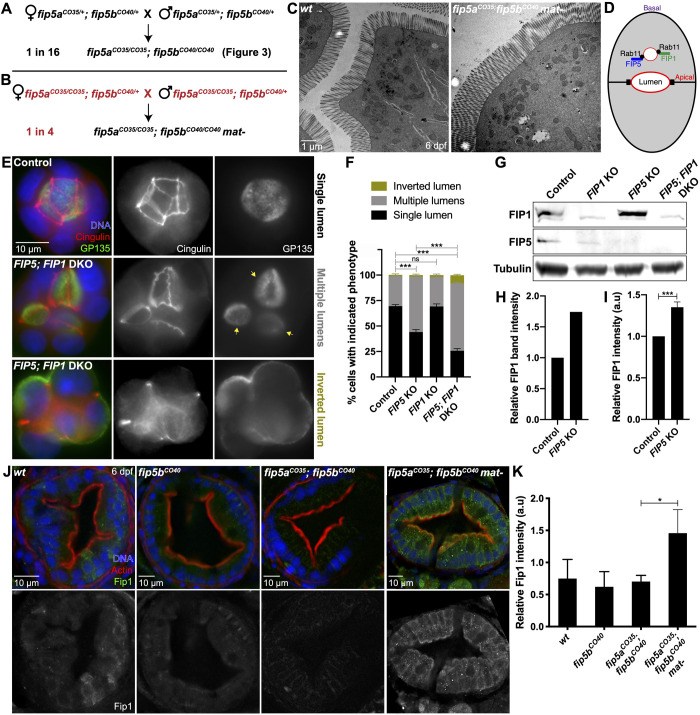
Upregulation of Fip1 rescues fip5a and fip5b double-mutant phenotypes. (A,B) Schematic of genetic crosses resulting in fip5aCO35; fip5bCO40 double zygotic or maternal/zygotic (mat-) mutant offspring generated from two different parental genotypes. (C) Electron micrographs showing cross sections through midgut of 6 dpf wild-type AB and fip5aCO35; fip5bCO40 mat- mutant larvae. Three separate animals for each condition were analyzed. (D) Cartoon schematic showing FIP5 and FIP1 bind same Rab11 vesicles. (E) Wild-type and FIP5; FIP1 double KO (DKO) MDCK cells grown in an extracellular matrix to induce 3D lumen formation. Arrows denote multiple lumens in KO cyst. (F) Quantitation of luminal phenotypes from three biological replicates. (G) Western blot on wild-type and KO MDCK cell lysates probed for FIP1, FIP5 or tubulin (control) antibodies. (H) Quantitation of FIP1 band intensity for wild-type and FIP5 KO cell lysates from one biological replicate. (I) Quantitation of FIP1 fluorescence intensity in wild-type and FIP5 KO cells grown in polarized monolayers from three biological replicates. Representative images are shown in Fig. S4A. (J) Immunohistochemistry on cross sections through midgut of 6 dpf wild-type, fip5bCO40 mutant, fip5aCO35; fip5bCO40 double mutant and fip5aCO35; fip5bCO40 mat- mutant larvae stained with Hoechst (blue), Phalloidin (red) and Fip1 (green). (K) Quantitation of fluorescence intensity of Fip1. Three separate animals for each condition were analyzed. All plots show mean±s.e.m. A t-test was used for Gaussian data and a Mann–Whitney test for all other statistics. ***P<0.0005, *P<0.05.

Figure Data
Acknowledgments
This image is the copyrighted work of the attributed author or publisher, and ZFIN has permission only to display this image to its users. Additional permissions should be obtained from the applicable author or publisher of the image. Full text @ Biol. Open