
Image
|
Figure Caption
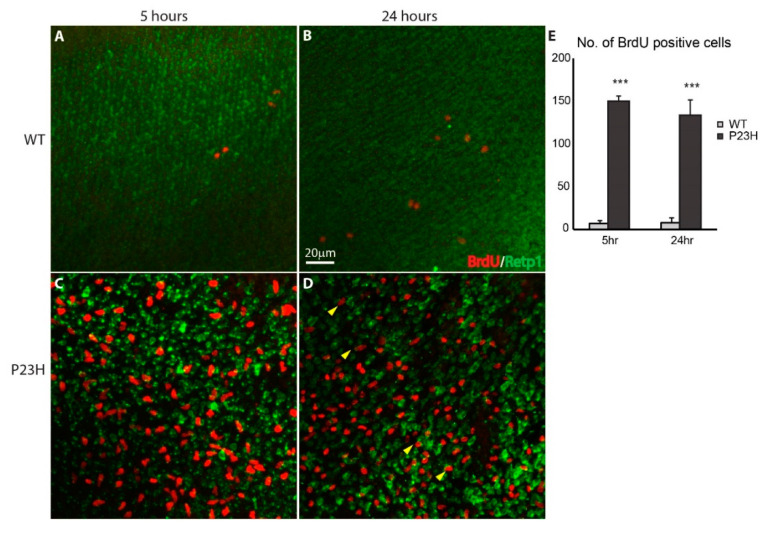
Figure 6
Continuous cell proliferation in the P23H transgenic zebrafish. Wholemount imaging of BrdU (red) labeled cells in ONL of the WT (
Figure Data
Acknowledgments
This image is the copyrighted work of the attributed author or publisher, and
ZFIN has permission only to display this image to its users.
Additional permissions should be obtained from the applicable author or publisher of the image.
Full text @ Cells