IMAGE

Fig. 5

ID
ZDB-IMAGE-201026-19
Source
Figures for Choi et al., 2020
Image
Figure Caption

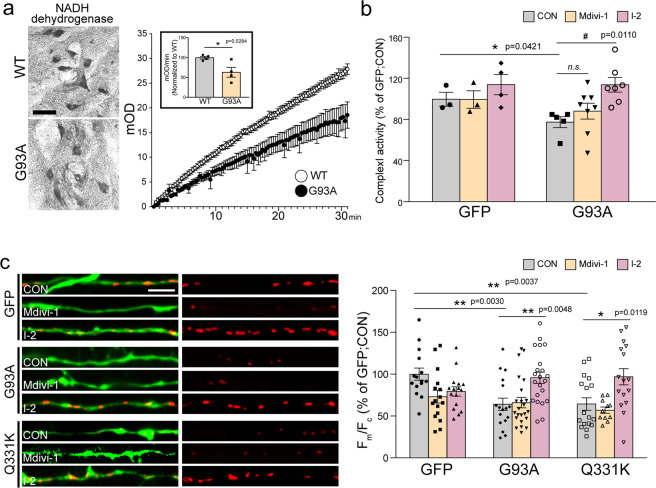
Fig. 5 Effects of the blockade of PP1 on the complex I activity of mitochondria in the ALS model.

a The histological image of NADH dehydrogenase activity and biochemical measurement of complex I activity on the MNs of the lumbar spinal cord in G93A and WT mice at 60 days of age. The inset graph shows the average of the complex I activity value. WT = 99.74 ± 3.83 (n = 4 mice), G93A = 62.9 ± 12.37 (n = 4 mice). Values are mean ± S.E.M. F(1,6) = 2.87, *P = 0.0284 by two-sided Student’s t-test. Scale bar, 100 μm. b The activity of mitochondrial complex I in primary cortical neurons cultured from WT and G93A mice following treatment with 25 µM Mdivi-1 or 80 nM I-2 for 72 h. WT:CON = 99.69 ± 6.81 (n = 3 independent primary culture), WT:Mdivi-1 = 99.37 ± 8.55 (n = 3 independent primary culture), WT:I-2 = 113.9 ± 9.12 (n = 4 independent primary culture), G93A:CON = 77.36 ± 5.33 (n = 5 independent primary culture), G93A:Mdivi-1 = 88.09 ± 7.70 (n = 8 independent primary culture), G93A:I-2 = 113.7 ± 7.09 (n = 7 independent primary culture). Values are mean ± S.E.M. F(1,6)=2.58, *P = 0.0421 for WT:CON versus G93A:CON by by two-sided Student’s t-test; F(2,17)=6.22, #P = 0.0110 for G93A:CON versus G93A:I-2, n.s. = not significant group by one-way ANOVA followed by Tukey’s multiple comparisons test. c The representative images and measurement of MMP in GFP+ primary cortical neurons following mALS gene transfection with 25 µM Mdivi-1 or 80 nM I-2 treatment for 72 h. GFP:CON = 1 ± 0.07 (n = 15 GFP+ primary cortical neurons), GFP:Mdivi-1 = 0.73 ± 0.08 (n = 16 GFP+ primary cortical neurons), GFP:I-2 = 0.92 ± 0.06 (n = 16 GFP+ primary cortical neurons), G93A:CON = 0.66 ± 0.06 (n = 23 GFP+ primary cortical neurons), G93A:Mdivi-1 = 0.64 ± 0.07 (n = 17 GFP+ primary cortical neurons), G93A:I-2 = 0.96 ± 0.07 (n = 22 GFP+ primary cortical neurons), Q331K:CON = 0.64 ± 0.07 (n = 17 GFP+ primary cortical neurons), Q331K:Mdivi-1 = 0.57 ± 0.04 (n = 11 GFP+ primary cortical neurons), Q331K:I-2 = 0.97 ± 0.10 (n = 16 GFP+ primary cortical neurons). Values are mean ± S.E.M. F(2,52) = 7.529, **P = 0.0030 for GFP:CON versus G93A:CON, **P = 0.0037 for GFP:CON versus Q331K:GFP; F(2,44) = 3.86, *P = 0.0268 for GFP:CON versus GFP:Mdivi-1; F(2,59) = 7.184, **P = 0.0048 for G93A:CON versus G93A:I-2; F(2,41) = 6.87, *P = 0.0119 for Q331K:CON versus Q331K:I-2 by one-way ANOVA followed by Tukey’s multiple comparisons test. Scale bar, 20 μm.

Acknowledgments
This image is the copyrighted work of the attributed author or publisher, and ZFIN has permission only to display this image to its users. Additional permissions should be obtained from the applicable author or publisher of the image. Full text @ Cell Death Dis.