Figure Caption
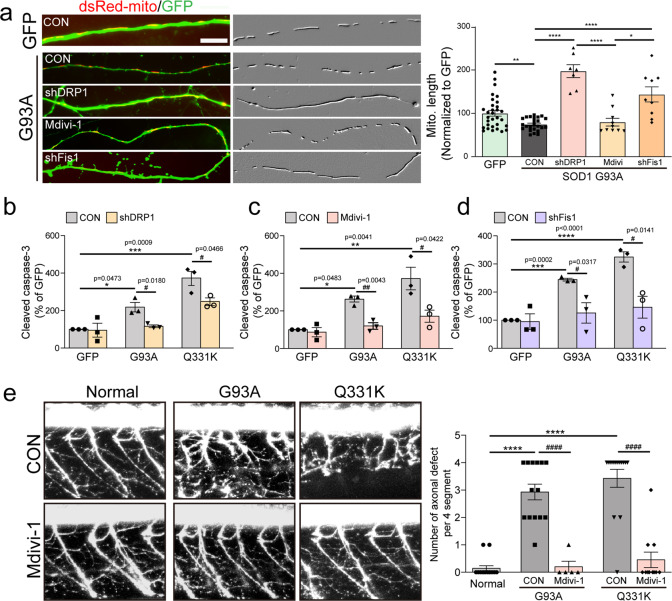
Fig. 2
Effects of the blockade of Drp1 activity on ALS mutant-induced pathological features.Analysis of mitochondrial length ((a) N = 10 per group) and active caspase-3-positive neurons (b–d) after 3 days following shRNA co-transfection or 25 μM Mdivi-1 treatment with G93A or Q331K clone. Mitochondrial images have been embossed. GFP = 100.1 ± 6.54 (n = 31 GFP+ neurons), SOD G93A:CON = 74.55 ± 6.54 (n = 24 GFP+ neurons), SOD G93A:shDRP1 = 197.3 ± 14.96 (n = 7 GFP+ neurons), SOD G93A:Mdivi = 105.5 ± 8.79 (n = 10 GFP+ neurons), SOD G93A:shFis1 = 143.7 ± 17.38 (n = 9 GFP+ neurons). Values are mean ± S.E.M. F(1,53) = 3.239, **P = 0.0021 for GFP versus SOD G93A:CON by two-sided Student’s t-test. F(3,46) = 33.54, *P = 0.0440, ****P < 0.0001 by one-way ANOVA with Tukey’s post hoc analysis for multiple comparisons in (a). GFP:CON = 100 ± 0.00 (n = 3 independent primary cultures), GFP:shDRP1 = 95.25 ± 36.86 (n = 3 independent primary cultures), G93A:CON = 218 ± 25.18 (n = 3 independent primary cultures), G93A:shDRP1 = 116.4 ± 7.52 (n = 3 independent primary cultures), Q331K:CON = 370 ± 38.99 (n = 3 independent primary cultures), Q331K:shDRP1 = 247.6 ± 18.38 (n = 3 independent primary cultures). Values are mean ± S.E.M. F(2,6) = 25.58, *P = 0.0473, ***P = 0.009 by one-way ANOVA with Tukey’s post hoc analysis for multiple comparisons. F(1,4) = 0.1289, P = 0.9037 for GFP:CON versus GFP:shDRP1; F(1,4) = 3.869, #P = 0.0180 for G93A:CON versus G93A:shDRP1; F(1,4) = 2.846, #P = 0.0466 for Q331K:CON versus Q331K:shDRP1 by two-sided Student’s t-test in (b). GFP:CON = 99.98 ± 0.03 (n = three independent primary cultures), GFP:Mdivi-1 = 86.85 ± 24.57 (n = 3 independent primary cultures), G93A:CON = 257 ± 15.85 (n = 3 independent primary cultures), G93A: Mdivi-1 = 119.9 ± 17.42 (n = 3 independent primary cultures), Q331K:CON = 372 ± 60.06 (n = 3 independent primary cultures), Q331K: Mdivi-1 = 171.9 ± 32.03 (n = 3 independent primary cultures). Values are mean ± S.E.M. F(2,6)=14.53, *P = 0.0483, **P = 0.0041 by one-way ANOVA with Tukey’s post hoc analysis for multiple comparisons. F(1,4) = 0.5345, P = 0.6213 for GFP:CON versus GFP:shDRP1; F(1,4) = 5.819, ##P = 0.0043 for G93A:CON versus G93A:shDRP1; F(1,4) = 2.922, #P =0 .0422 for Q331K:CON versus Q331K:shDRP1 by two-sided Student’s t-test in (c). GFP:CON = 100 ± 0.03 (n = 3 independent primary cultures), GFP:shFis1 = 94.73 ± 27.67 (n = 3 independent primary cultures), G93A:CON = 244 ± 4.88 (n = 3 independent primary cultures), G93A:shFis1 = 125.8 ± 36.28 (n = 3 independent primary cultures), Q331K:CON = 324.9 ± 18.34 (n = 3 independent primary cultures), Q331K: shFis1 = 146 ± 38.89 (n = 3 independent primary cultures). Values are mean ± S.E.M. F(2,6) = 108.1, ***P = 0.0002, ****P < 0.0001 by one-way ANOVA with Tukey’s post hoc analysis for multiple comparisons. F(1,4) = 0.1922, P = 0.8569 for GFP:CON versus GFP:shDRP1; F(1,4) = 3.24, #P = 0.0317 for G93A:CON versus G93A:shDRP1; F(1,4) = 2.922, #P = 0.0141 for Q331K:CON versus Q331K:shDRP1 by two-sided Student’s t-test in (d). Scale bar, 5 μm. e Zebrafish expressing G93A and Q331 with 2.5 μM Mdivi-1 daily treatment over 2 days, and the number of axonal defects of MNs counted for each of the four segments. Normal = 0.14 ± 0.1 (n = 14 zebrafish), G93A:CON = 2.93 ± 0.29 (n = 14 zebrafish), G93A:Mdivi-1 = 0.2 ± 0.2 (n = 5 zebrafish), Q331K:CON = 3.43 ± 0.33 (n = 14 zebrafish), Q331K:Mdivi-1 = 0.45 ± 0.28 (n = 11 zebrafish). Values are mean ± S.E.M. F(2,39) = 47.44, ****P < 0.0001 by one-way ANOVA with Tukey’s post hoc analysis for multiple comparisons.; F(1,17) = 5.445, ####P < 0.0001 for G93A:CON versus G93A:Mdivi-1, F(1,23) = 6.671, ####P < 0.0001 for Q331K:CON versus Q331K: Mdivi-1 by two-sided Student’s t-test.
Acknowledgments
This image is the copyrighted work of the attributed author or publisher, and
ZFIN has permission only to display this image to its users.
Additional permissions should be obtained from the applicable author or publisher of the image.
Full text @ Cell Death Dis.