IMAGE

Fig. 3

ID
ZDB-IMAGE-201026-13
Source
Figures for Choi et al., 2020
Image
Figure Caption

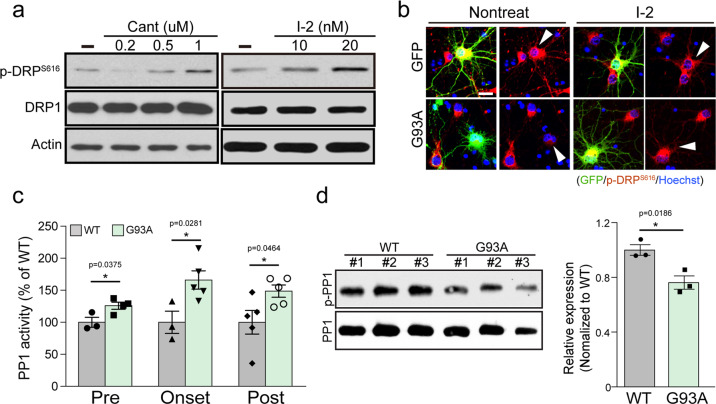
Fig. 3 Dephosphorylation of the site S616 of Drp1 by PP1 and the increase in PP1 activity in the lumbar spinal cord of G93A mice.

a Western blot analysis of p-Drp1 S616 and Drp1 expression level in primary cortical neuron with Cantharidin (for 1 h) or I-2 (for 1 day) treatment. b Representative immunostaining image of p-Drp1 S616 (red) in GFP+ primary cortical neuron with or without 80 nM I-2 treatment for 24 h. Arrowhead indicates the GFP-positive neuron. Scale bar, 20 μm. c PP1 activity in the lumbar spinal cord of G93A and WT mice at 60, 100, and 200 days of age. WT:Pre = 100 ± 7.79 (n = 3 mice), G93A:Pre = 125.9 ± 5.51 (n = 4 mice), WT:Onset = 100 ± 17.35 (n = 3 mice), G93A: Onset = 166 ± 14.32 (n = 5 mice), WT:Post = 100 ± 18.35 (n = 5 mice), G93A:Post = 148.7 ± 9.58 (n = 5 mice). Values are mean ± S.E.M. F(1,5) = 2.811, *P = 0.0375 for WT:Pre versus G93A:Pre; F(1,6) = 2.88, *P = 0.0281 for WT:Onset versus G93A:Onset; F(1,8) = .354, *P = 0.0464 for WT:Post versus G93A:Post by two-sided Student’s t-test. d Western blot analysis of p-PP1 and PP1 expression in the lumbar spinal cord of G93A and WT mice at the onset period. The graph shows the quantification of p-PP1 vs. PP1 intensity. WT = 1.00 ± 0.04 (n = 3 mice), G93A = 0.76 ± 0.05 (n = 3 mice). Values are mean ± S.E.M. F(1,4) = 3.832, *P = 0.0186 by two-sided Student’s t-test.

Acknowledgments
This image is the copyrighted work of the attributed author or publisher, and ZFIN has permission only to display this image to its users. Additional permissions should be obtained from the applicable author or publisher of the image. Full text @ Cell Death Dis.