
|
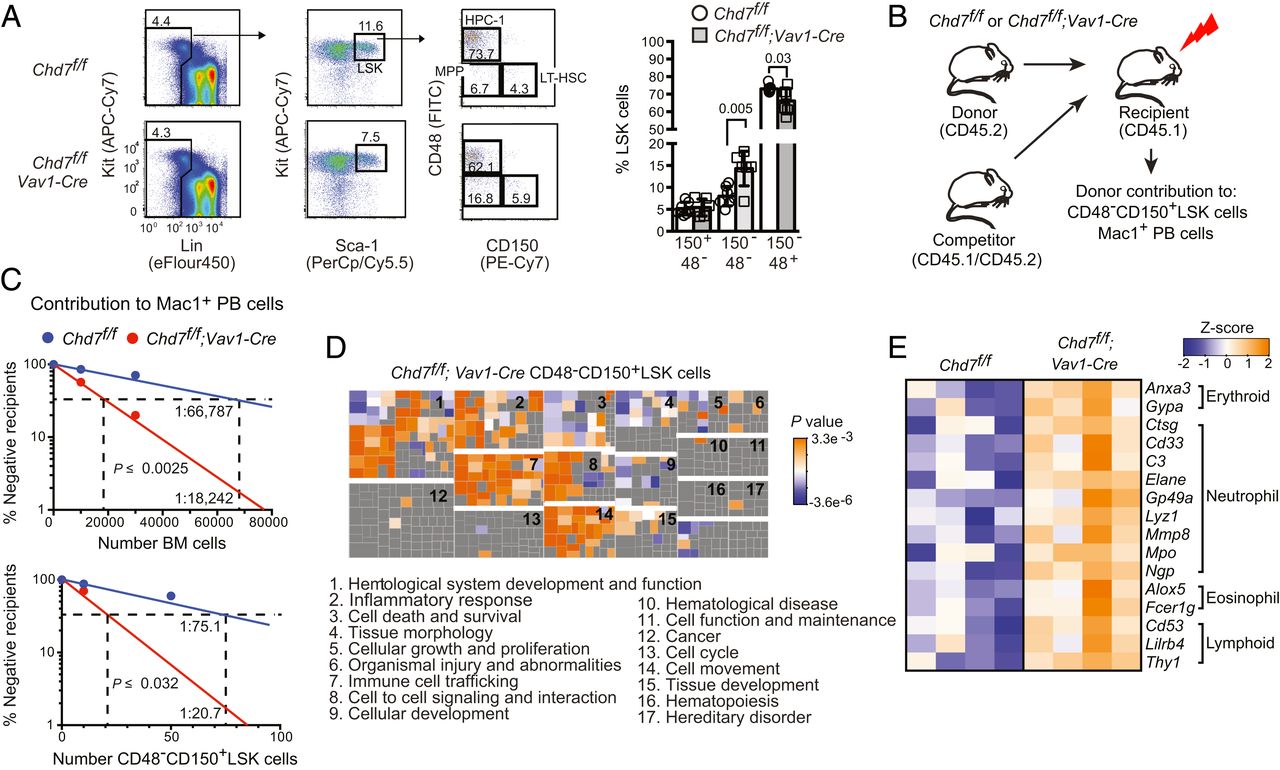
Fig. 2 CHD7 regulates hematopoiesis cell autonomously. (A) Chd7 deficiency does not affect phenotypic LT-HSCs. Flow cytometry of LT-HSCs (CD48−CD150+), MPPs (CD48−CD150−), and HPC-1s (CD48+CD150−) from LinnegSca1+Kit+ (LSK) bone marrow populations (Left), which is quantified in bar graph (Right) (n = 6 to 7). Mean ± SD, unpaired two-tailed t test. (B) Schematic diagram of mouse limiting dilution transplantation experiments. (C) The frequency of functional CHD7-deficient LT-HSCs increased two-fold in whole BM (Left) and in purified CD48−CD150+LSK cells (Right) when ≥1% donor contribution to Mac1+ PB was scored at 4 mo. LT-HSC frequency was calculated by ELDA (n = 7 to 14 recipients per dose). (D) Loss of CHD7 increases multilineage hematopoiesis. (Top) Functional categories for genes up-regulated in CHD7-deficient mouse LT-HSCs were enriched for hematopoietic-related functions by IPA. Clusters of individual functional gene annotations (squares) belonging to each category are labeled numerically. Replicates: 4. (E) Heatmap of representative lineage-specific genes up-regulated in CHD7-deficient CD48−CD150+LSK cells.