
|
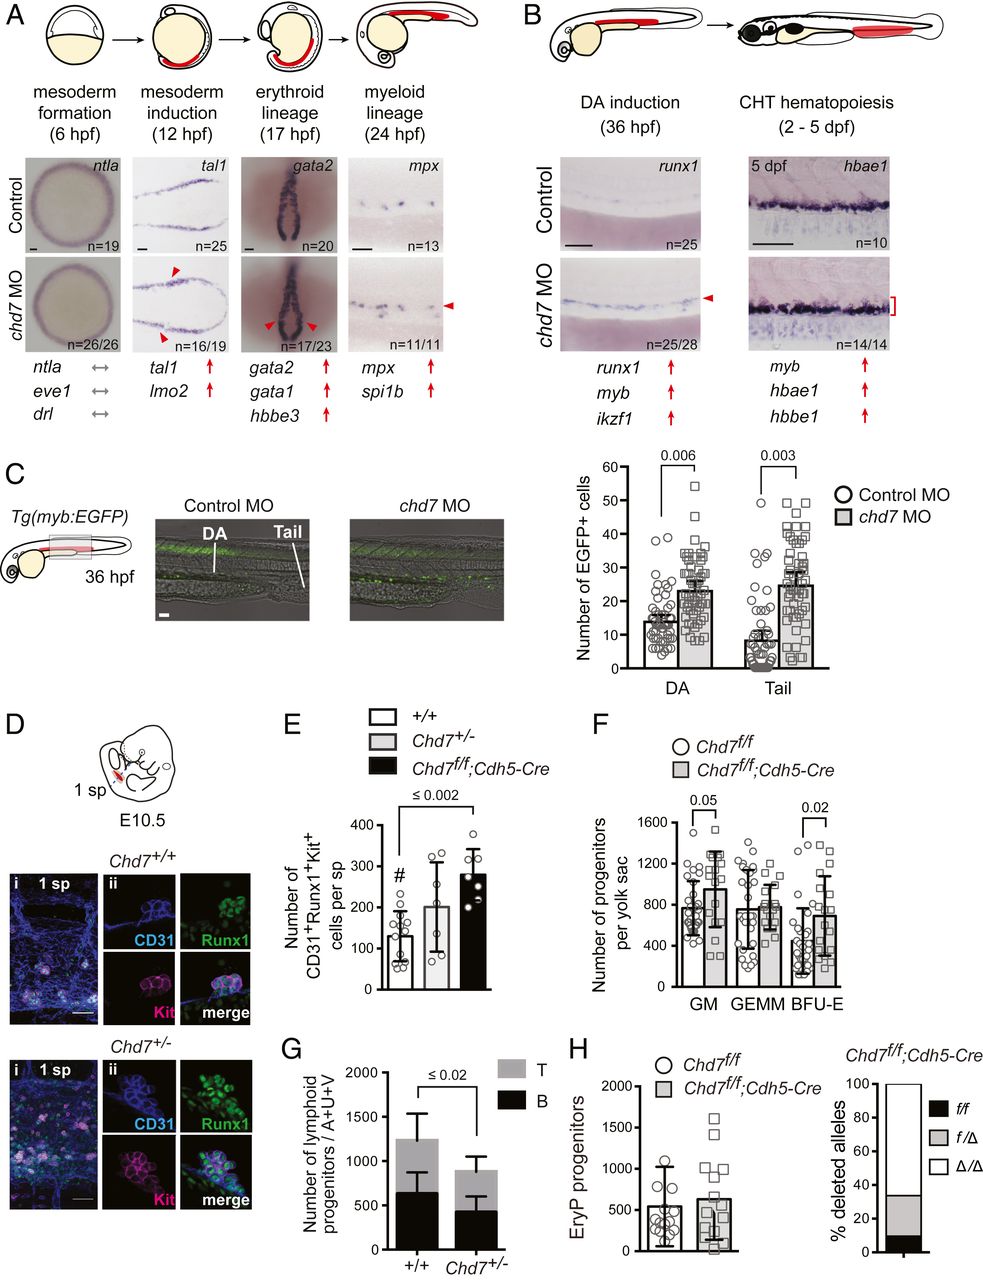
Fig. 1 Chd7 negatively regulates embryonic hematopoiesis. (A) Chd7 knockdown increases expression of hematopoietic mesodermal precursor, primitive erythroid and myeloid, but not early mesoderm genes. Representative embryos for whole-mount in situ hybridization are shown, with additional genes shown in SI Appendix, Fig. S2. Regions of blood development are highlighted in red in the embryo schematic. Red arrows and arrowheads indicate an increase. Gray arrows indicate no change. (Scale bars, 50 μm.) Replicates: 2. (B) Chd7 knockdown increases expression of definitive HSPC and definitive myeloid and erythroid genes. Same symbols as in A. (C) Chd7 knockdown in Tg(myb:EGFP) embryos increases EGFP+ cells in the DA and tail region (Left), which is quantified in graph (Right) (n = 53 to 55). Representative embryos shown are from three independent replicates. (D) Chd7 deletion in mice increases Runx1+CD31+Kit+ hematopoietic clusters detected by confocal imaging of E10.5 Chd7+/+, Chd7+/−, and Chd7f/f; Cdh5-Cre AGM regions. Representative clusters shown. (i) One somite pair (sp) area. (ii) Individual cluster. (E) Quantification of data from D (n = 7 to 13). One-way ANOVA, Dunnett’s multiple comparison test; #, comparator. (F) Increased number of burst-forming unit–erythroid (BFU-E) and granulocyte/monocyte progenitors (colony-forming unit for granulocytes and macrophages) in E10.5 Chd7+/− yolk sacs (n = 8 to 14). GEMM, granulocyte/erythrocyte/monocyte/megakaryocyte progenitors. (G) Reduced number of lymphoid progenitors in E10.5 Chd7+/− embryos (n = 10 to 12). A+U+V: AGM, umbilical, and vitelline arteries. (H, Left) The number of erythroid progenitors (EryP) in the yolk sac of Chd7f/f;Cdh5-Cre embryos is not altered (n = 14 to 15). (H, Right) Both Chd7f alleles were deleted in 65% of the EryP colonies, and one allele was deleted in 27% of the colonies; thus Cdh5-Cre was active in the majority of EryPs or their precursors (n = colonies from 6 to 8 yolk sacs). All graphs show mean ± SD, unpaired two-tailed t test unless otherwise specified.