IMAGE

Figure 4

ID
ZDB-IMAGE-201003-9
Source
Figures for Quan et al., 2020
Image
Figure Caption

Figure 4

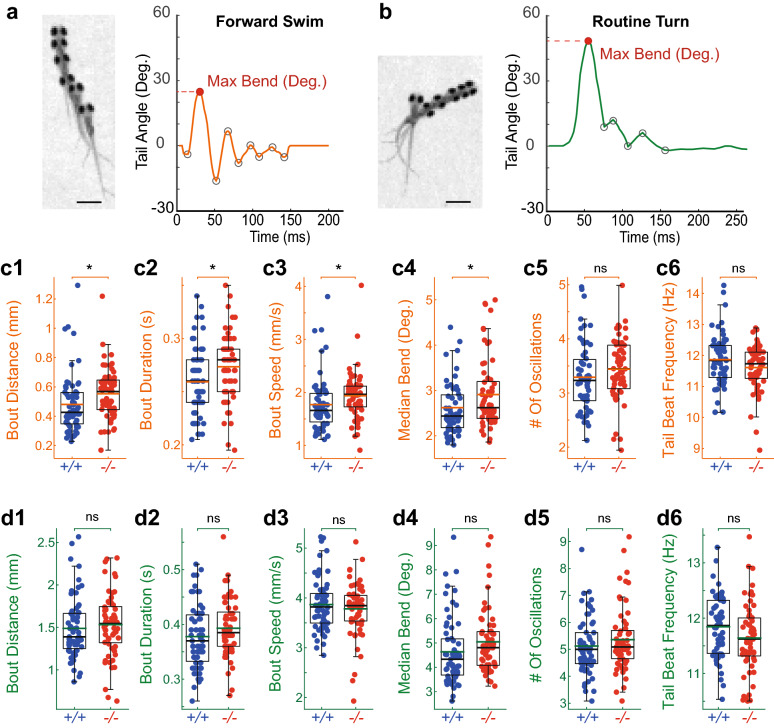
Somatostatin 1.1 null mutant larvae explore more by deploying longer and faster forward swims. (a) Left, Superimposed images illustrating the sequence of positions observed during a forward swim (scale bar, 1 mm); right, typical forward swim showing the tail angle trace over time with a maximal bend amplitude below 25 degrees. Subsequent peaks (grey circles) correspond to each bend amplitude. (b) Left, superposed images illustrating the sequence of movements during routine turn (scale bar, 1 mm); right, tail angle trace over time of typical routine turn showing the maximal bend amplitude above 25 degrees. (c1c6) Forward swims in sst1.1icm40/icm40 mutant (red, ‘−/−’) had larger distance traveled (c1, mean ± SEM 0.56 ± 0.02 mm versus 0.48 ± 0.03 mm in WTs; Wald χ2(1) = 7.340, p = 0.027), bout duration (c2, mean ± SEM 0.27 ± 0.004 s versus 0.26 ± 0.004 s in WTs; Wald χ2(1) = 7.171, p = 0.030), speed (c3, mean ± SEM 1.96 ± 0.06 mm/s versus 1.78 ± 0.07 mm/s in WTs; Wald χ2(1) = 6.955, p = 0.033) and median bend amplitude (c4, mean ± SEM 2.88 ± 0.10 degrees versus 2.57 ± 0.07 degrees in WTs; Wald χ2(1) = 6.529, p = 0.042) but no difference in number of oscillations (c5, mean ± SEM 3.47 ± 0.07 versus 3.29 ± 0.08 in WTs; Wald χ2(1) = 2.789, p = 0.380), tail beat frequency (c6, mean ± SEM 11.66 ± 0.09 Hz versus 11.84 ± 0.10 Hz in WTs; Wald χ2(1) = 1.785, p = 0.726). Black lines, median; Orange lines, mean. Meff = 4.003. (d1d6) Routine turns were undistinguishable in sst1.1icm40/icm40 mutant larvae compared to WTs siblings: Bout distance (d1, mean ± SEM 1.57 ± 0.04 mm versus 1.49 ± 0.05 mm in WTs; Wald χ2(1) = 1.910, p = 0.755); bout duration (d2, mean ± SEM 0.38 ± 0.01 s versus 0.37 ± 0.01 s in WTs; Wald χ2(1) = 4.025, p = 0.203); speed (d3, mean ± SEM 3.86 ± 0.05 mm/s versus 3.86 ± 0.07 mm/s in WTs; Wald χ2(1) = 0.021, p = 1); median bend amplitude (d4, 4.87 ± 0.14 degrees versus 4.60 ± 0.17 degrees in WTs; Wald χ2(1) = 1.853, p = 0.784); number of oscillations (d5, 5.42 ± 0.16 versus 5.12 ± 0.13 in WTs; Wald χ2(1) = 2.464, p = 0.526); tail beat frequency (d6, 11.68 ± 0.08 Hz versus 11.84 ± 0.07 Hz in WTs; Wald χ2(1) = 2.054, p = 0.686). Black lines, median; Green lines, mean. Each point represents the median for one fish over the 5 min-long recording. Meff = 4.518. Comparison between 62 WT larvae from 4 clutches (17 834 bouts) and 58 sst1.1icm40/icm40 mutant larvae from 4 clutches (16 043 bouts) were tested with Wald χ2.

Figure Data
Acknowledgments
This image is the copyrighted work of the attributed author or publisher, and ZFIN has permission only to display this image to its users. Additional permissions should be obtained from the applicable author or publisher of the image. Full text @ Sci. Rep.