IMAGE

Figure 2

ID
ZDB-IMAGE-201003-6
Source
Figures for Quan et al., 2020
Image
Figure Caption

Figure 2

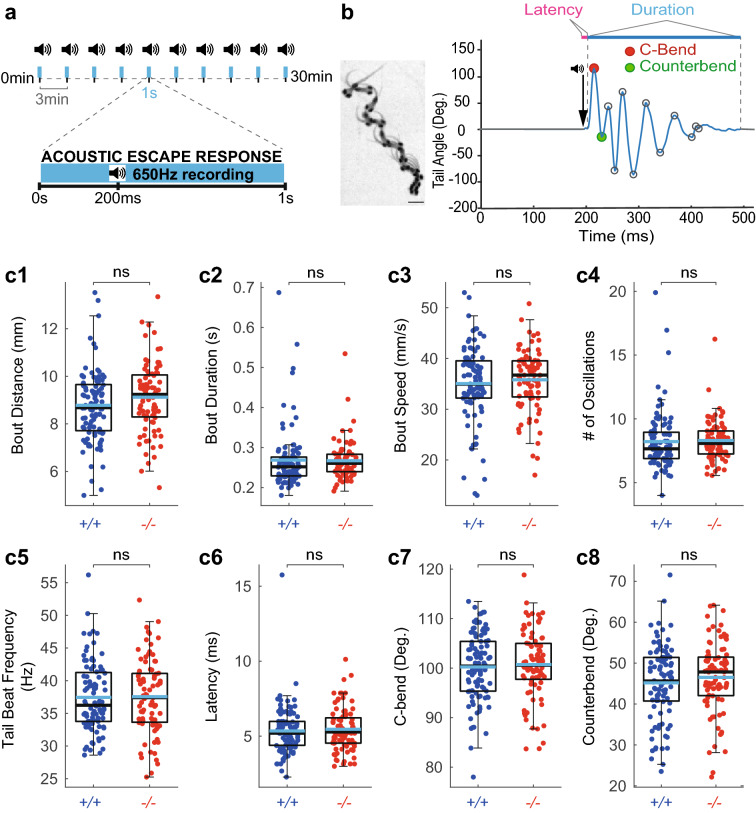
Somatostatin 1.1 does not contribute to the kinematic of acousto-vestibular escape responses. (a) Experimental paradigm used to record the escape response of 5 dpf zebrafish larvae to AV stimuli delivered for 5 ms at 500 Hz. Larvae were subjected to 10 trials interspaced by 3 min. Behavioral responses were recorded for 1 s at 650 Hz. (b) Left, Superimposed images illustrating the sequence of movements during a typical AV escape response (scale bar: 1 mm). Right, tail angle trace over time of escape response showing the large C-bend (red circle) followed by the counter bend (green circle) characteristic of the escape response. Latency is defined as the delay between the time of the acoustic stimulus and the onset of the behavioral response; Tail beat frequency (TBF) calculated as the number of oscillations divided by the bout duration. (c1c8) No difference in AV escape responses between sst1.1icm40/icm40 mutants (‘−/−’, 84 larvae from 4 clutches and 761 escapes) and WT siblings (‘+/+’, 96 larvae from 4 clutches and 861 escapes): distance (c1, mean ± SEM 9.12 ± 0.16 mm versus 8.73 ± 0.15 mm in WTs; Wald χ2(1) = 1.047, p = 1), bout duration (c2, mean ±  SEM 0.27 ± 0.01 s versus 0.27 ± 0.01 s in WTs; Wald χ2(1) = 0.996, p = 1), speed (c3, mean ± SEM 35.73 ± 0.67 mm/s versus 34.97 ± 0.78 mm/s in WTs; Wald χ2(1) = 0.457, p = 1), number of oscillations (c4, mean ± SEM 8.27 ± 0.17 versus 8.22 ± 0.23 in WTs; Wald χ2(1) = 0.534, p = 1), tail beat frequency (c5, mean ± SEM 37.56 ± 0.62 Hz versus 37.45 ± 0.54 Hz in WTs; Wald χ2(1) = 0.001, p = 1), latency (c6, mean ± SEM 5.45 ± 0.16 ms versus 5.34 ± 0.17 ms in WTs; Wald χ2(1) = 7.297, p = 0.050), C-bend amplitude (c7, mean ± SEM 100.60 ± 0.76 degrees versus 100.20 ± 0.71 degrees in WTs; Wald χ2(1) = 0.023, p = 1) and counter bend amplitude (c8, mean ± SEM 46.51 ± 0.95 degrees versus 45.15 ± 0.93 degrees in WTs; Wald χ2(1) = 4.167, p = 0.298). Each dot represents the value for one larva averaged over ten trials. Median values are indicated in black, and means in blue; Statistical tests used: Wald chi-square test followed by Meff correction for multiple comparisons. Meff = 7.230.

Figure Data
Acknowledgments
This image is the copyrighted work of the attributed author or publisher, and ZFIN has permission only to display this image to its users. Additional permissions should be obtained from the applicable author or publisher of the image. Full text @ Sci. Rep.