IMAGE

Fig. 2

ID
ZDB-IMAGE-201003-237
Source
Figures for Corallo et al., 2020
Image
Figure Caption

Fig. 2

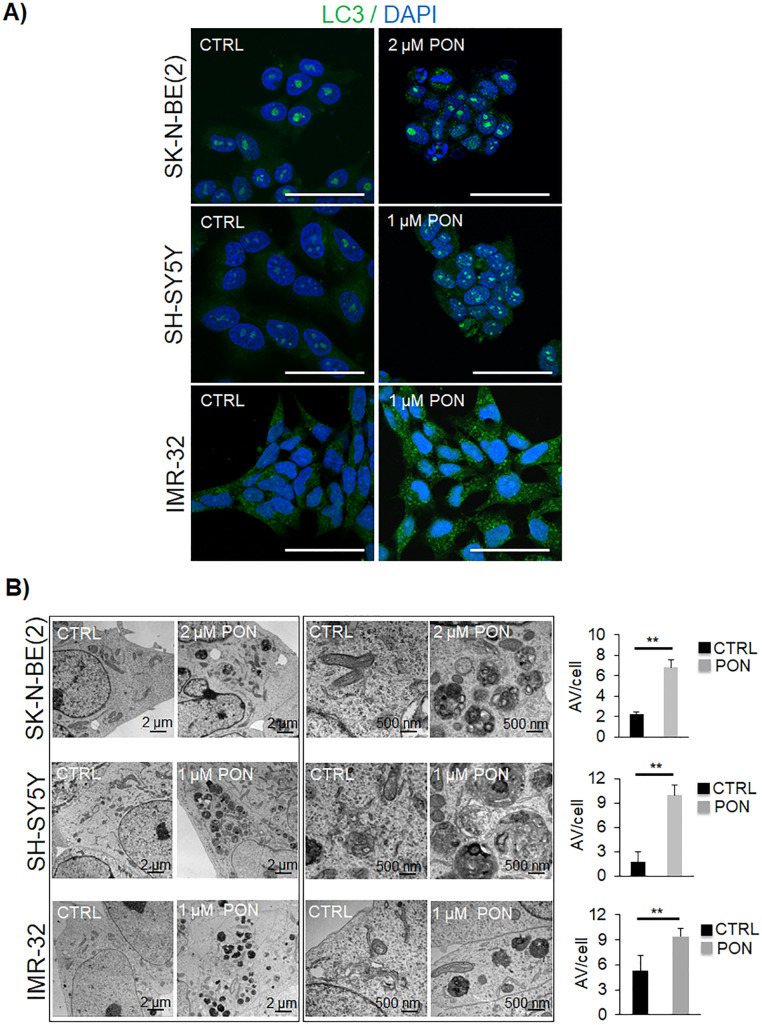
PON promotes autophagy vesicle accumulation in human neuroblastoma cells.a Tumor cells were treated with vehicle (CTRL) or PON at the indicated concentrations for 24 h. The presence of cytosolic puncta was detected through immunofluorescence analyses with LC3 antibody (green). Nuclei were counterstained with DAPI (blue). Scale bar, 50 μm. b Transmission electron microscopy images present the autophagic vacuoles (AV) in SK-N-BE(2), SH-SY5Y, and IMR-32 cells after 24 h of treatment with vehicle (CTRL) or PON. The scale bar is indicated in each image. Histograms on the right show the mean number of AVs formed per cell. **p < 0.01

Acknowledgments
This image is the copyrighted work of the attributed author or publisher, and ZFIN has permission only to display this image to its users. Additional permissions should be obtained from the applicable author or publisher of the image. Full text @ J. Exp. Clin. Cancer Res.