IMAGE

Fig. 1

ID
ZDB-IMAGE-201003-236
Source
Figures for Corallo et al., 2020
Image
Figure Caption

Fig. 1

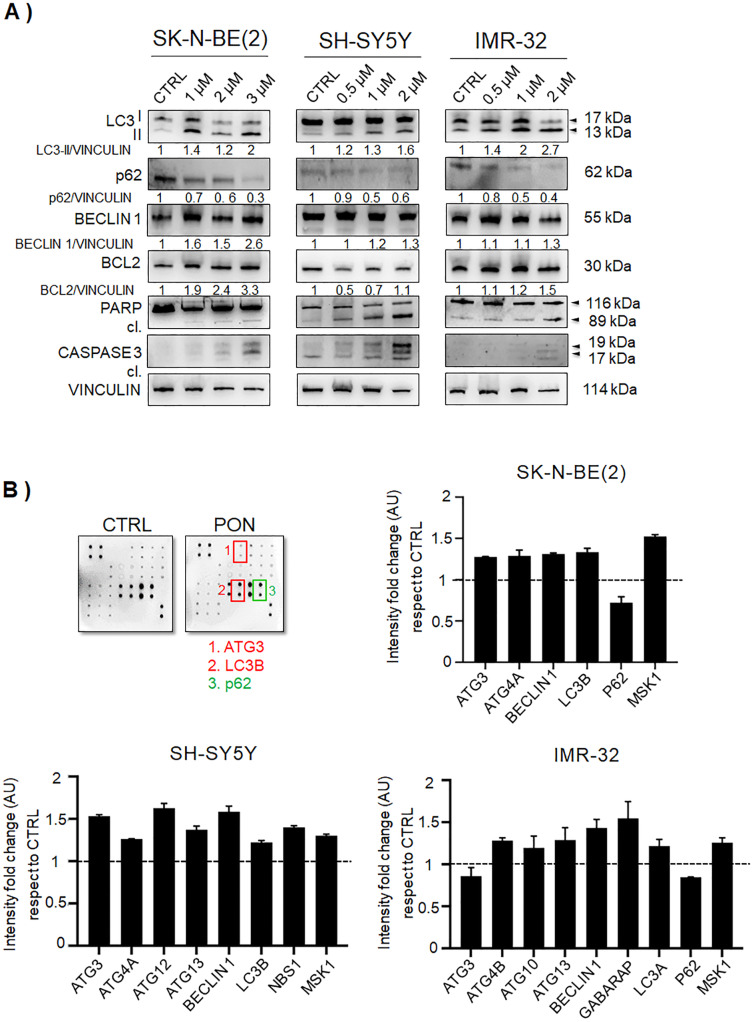
PON induces autophagy in neuroblastoma cells. a SK-N-BE(2), SH-SY5Y, and IMR-32 neuroblastoma cell lines were treated with the indicated increasing concentrations of PON or drug vehicle controls (CTRL) for 24 h. Total cell proteins were used for immunoblot analysis of the main autophagy regulators LC3, p62, and BECLIN 1. Apoptotic protein markers BCL2, total and cleaved (cl.) PARP, and cleaved (cl.) CASPASE 3 proteins were also examined. VINCULIN was used as loading control protein. The molecular weights are indicated in kilodaltons (kDa). Numbers indicate each protein/VINCULIN ratio as a fold change with respect to the controls (equal to 1) from two independent immunoblots. b Autophagy array was used to delineate the main autophagy players affected by PON in the SK-N-BE(2), SH-SY5Y, and IMR-32 cell lines. The results are normalized to internal positive controls, and the fold change is calculated with respect to the control lysates. ATG3, BECLIN 1, LC3, and MSK1 expressional changes were found in all three cell lines, while the other players differed between the examined cell lines. The data are presented as the value of the mean intensity fold change (AU). The proteins resulting in at least a 20% change are presented (p < 0.05)

Acknowledgments
This image is the copyrighted work of the attributed author or publisher, and ZFIN has permission only to display this image to its users. Additional permissions should be obtained from the applicable author or publisher of the image. Full text @ J. Exp. Clin. Cancer Res.