IMAGE

Fig. 4

ID
ZDB-IMAGE-201003-114
Source
Figures for Constantin et al., 2020
Image
Figure Caption

Fig. 4

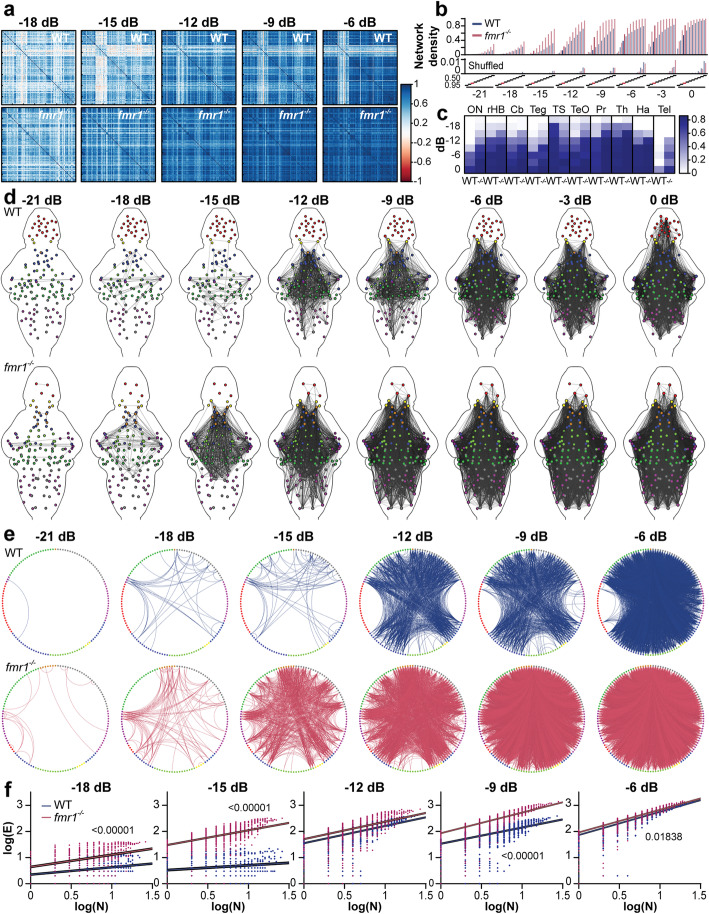
Functional brain-wide auditory networks in WT and fmr1−/− larvae. Correlation matrices (a) showing pairwise correlation strength across all pairs of nodes in WT (top) and fmr1−/− (bottom) larvae. Amplitudes are annotated as decibels from full volume (dB). Network density (b) of auditory sensitivity (top) and time-shuffled dataset (bottom) as a function of correlation coefficient thresholds and select. The 0.85 correlation coefficient threshold (red dash) was selected for subsequent analyses. The mean participation coefficient (c) for each region across eight amplitudes. Brain-wide auditory networks (d) showing edges exceeding a correlation coefficient of 0.85. Node color indicates brain region: octavolateralis nucleus (ON), magenta; cerebellum (Cb), dark green; hindbrain without the Cb and ON (rHB), gray; tegmentum (teg), light green; torus semicircularis (TS), dark magenta; optic tectum (TeO), blue; pretectum (Pr), light blue; thalamus (Th), orange; habenulae (Ha), yellow; telencephalon (Tel), red. Circle plots (e) of strongly correlated edges between nodes located in different brain regions (colored as d) for different sound amplitudes in WT and fmr1−/−. Log plots (f) of the number of nodes within a box (N) versus the number of edges crossing the box boundary (E) used to calculate the Rent exponent. Each dot represents an individual randomly placed and sized box (n = 5000), and the lines are robust linear regressions ± SD. P values ≤ 0.1 are shown

Acknowledgments
This image is the copyrighted work of the attributed author or publisher, and ZFIN has permission only to display this image to its users. Additional permissions should be obtained from the applicable author or publisher of the image. Full text @ BMC Biol.