IMAGE

Fig. 2

ID
ZDB-IMAGE-201003-112
Source
Figures for Constantin et al., 2020
Image
Figure Caption

Fig. 2

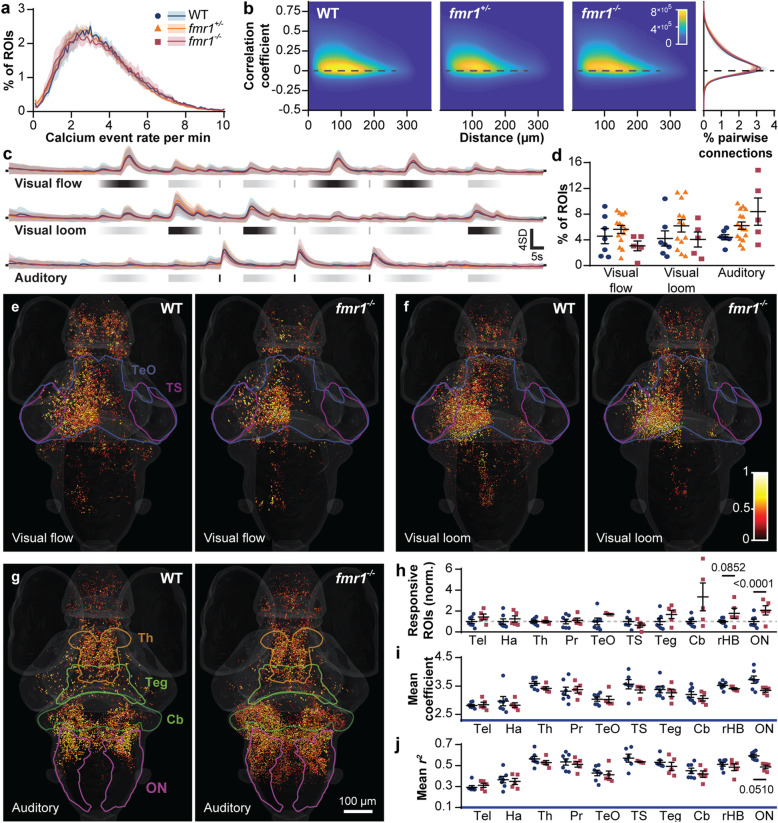
Brain-wide baseline and sensory-evoked neuronal activity. Distribution of brain-wide calcium event rates (a) in WT, fmr1+/−, and fmr1−/− larvae at baseline (mean ± s.e.m.). Heat map (b) of the correlation coefficient between pairs of ROIs as a function of their Euclidean distance, with the distribution of all coefficients (right) showing no marked differences between genotypes. Z-scored activity traces (c) of all ROIs responding to stimuli for each genotype (mean ± SD). Percent of ROIs (d) in the whole brain responding to each stimulus (mean ± s.e.m). Brain-wide responses to visual flow (e), visual loom (f), and auditory (g) stimuli (all panels equivalent to five larvae), where spot color represents response strength (regression coefficient) and spot diameter depicts coefficient of determination (r2 value). Ratio of ROIs (h), mean regression coefficients (i), and r2 values (j) in WT versus fmr1−/− responding to the auditory stimulus across various brain regions (mean ± s.e.m.). ON, octavolateralis nucleus; rHB, remaining hindbrain (without the cerebellum (Cb) and ON); Teg, tegmentum; TS, torus semicircularis; TeO, optic tectum; Pr, pretectum; Th, thalamus; Ha, habenulae; Tel, telencephalon. P values ≤ 0.1 are shown

Figure Data
Acknowledgments
This image is the copyrighted work of the attributed author or publisher, and ZFIN has permission only to display this image to its users. Additional permissions should be obtained from the applicable author or publisher of the image. Full text @ BMC Biol.