
|
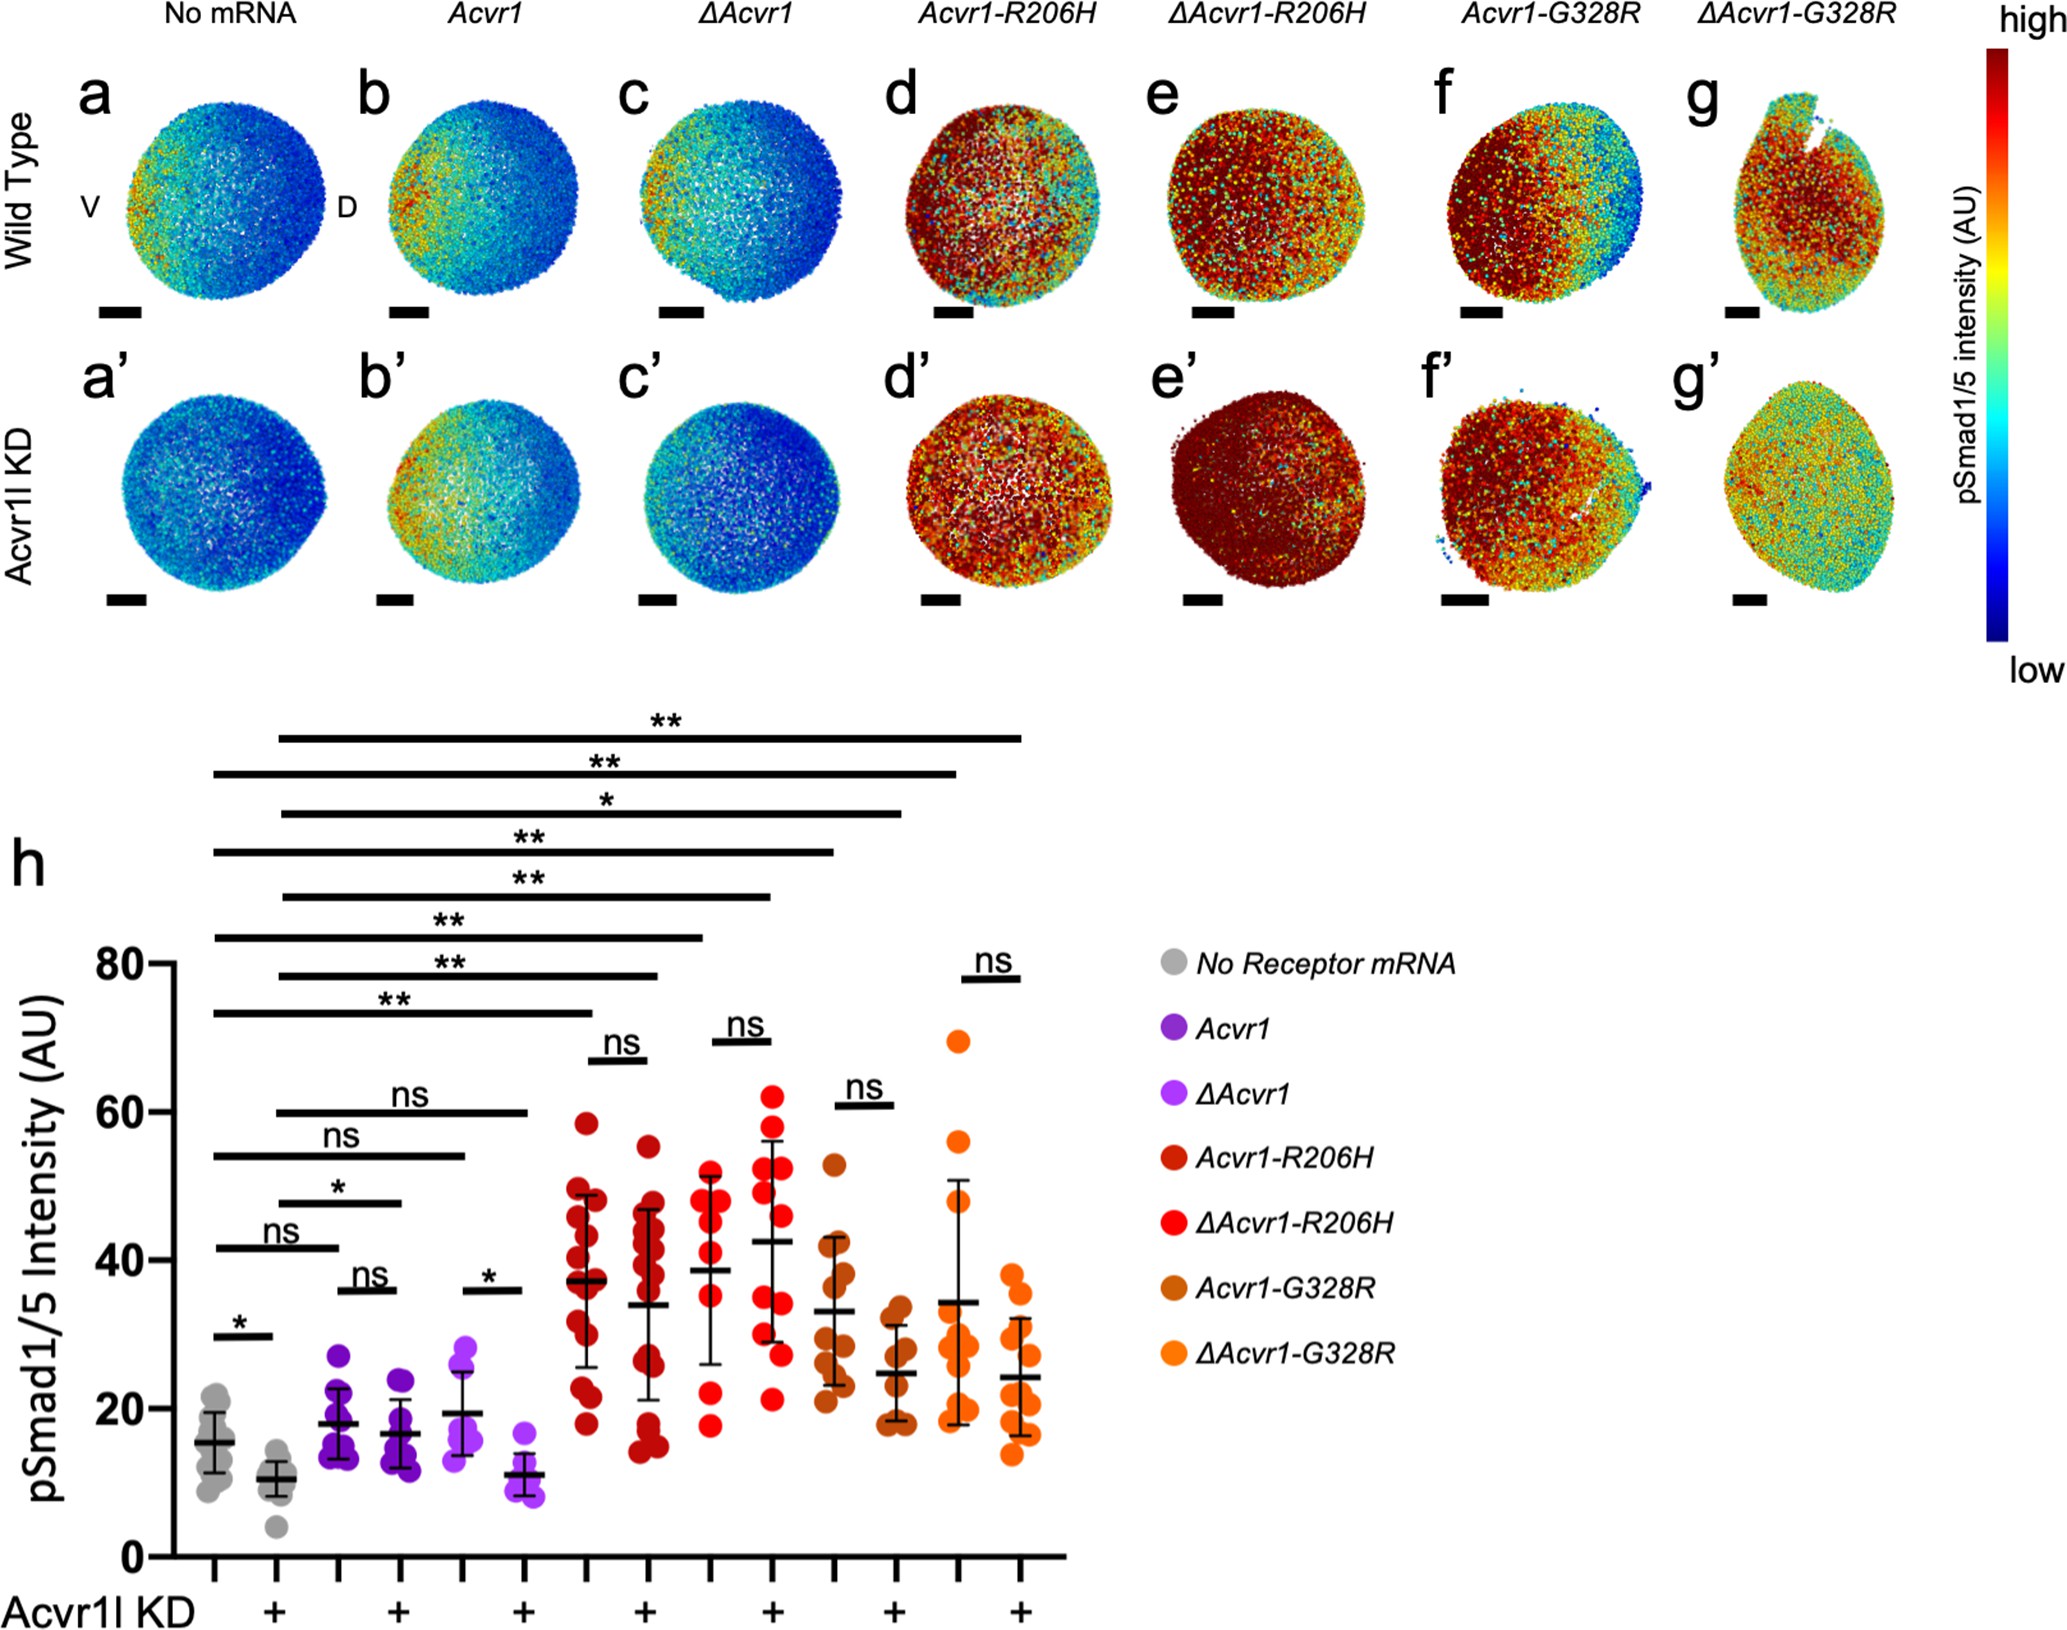
Fig. 2 (a,a’–g,g’) Animal pole view of relative pSmad1/5 intensities (using arbitrary units (AU)) within each nucleus of the embryo in representative WT early-gastrula embryos (shield-65% epiboly stage) with endogenous Acvr1l present (a–g) or knocked down (a’–g’). Injected mRNAs are noted above for b-g and b’-g’. (a–c, a’–c’) Embryos are oriented with ventral (V) side to the left and the dorsal (D) side to the right. (d–g, d’–g’) Dorsal side of the embryo could not be identified due to loss of the shield structure with severe ventralization. Scale bars = 100 μm. (a, a’) Wild-type and Acvr1l-KD embryos, respectively (N = 18 and 15). (b, b’) Acvr1 injected embryos (N = 10 and 9). (c, c’) ΔAcvr1 injected embryos (N = 9 and 7). (d, d’) Acvr1-R206H injected embryos (N = 14 and 17). (e, e’) ΔAcvr1-R206H injected embryos (N = 8 and 11). (f, f’) Acvr1-G328R injected embryos (N = 12 and 9). (g, g’) ΔAcvr1-G328R injected embryos (N = 12 and 12). (h) Mean nuclear pSmad1/5 fluorescence of injected embryos. Each dot represents the mean nuclear fluorescence for an individual embryo. Mean and standard deviation of each condition are shown by bars. * indicates p<0.05, ** indicates p<0.001, ns indicates no significance.