
|
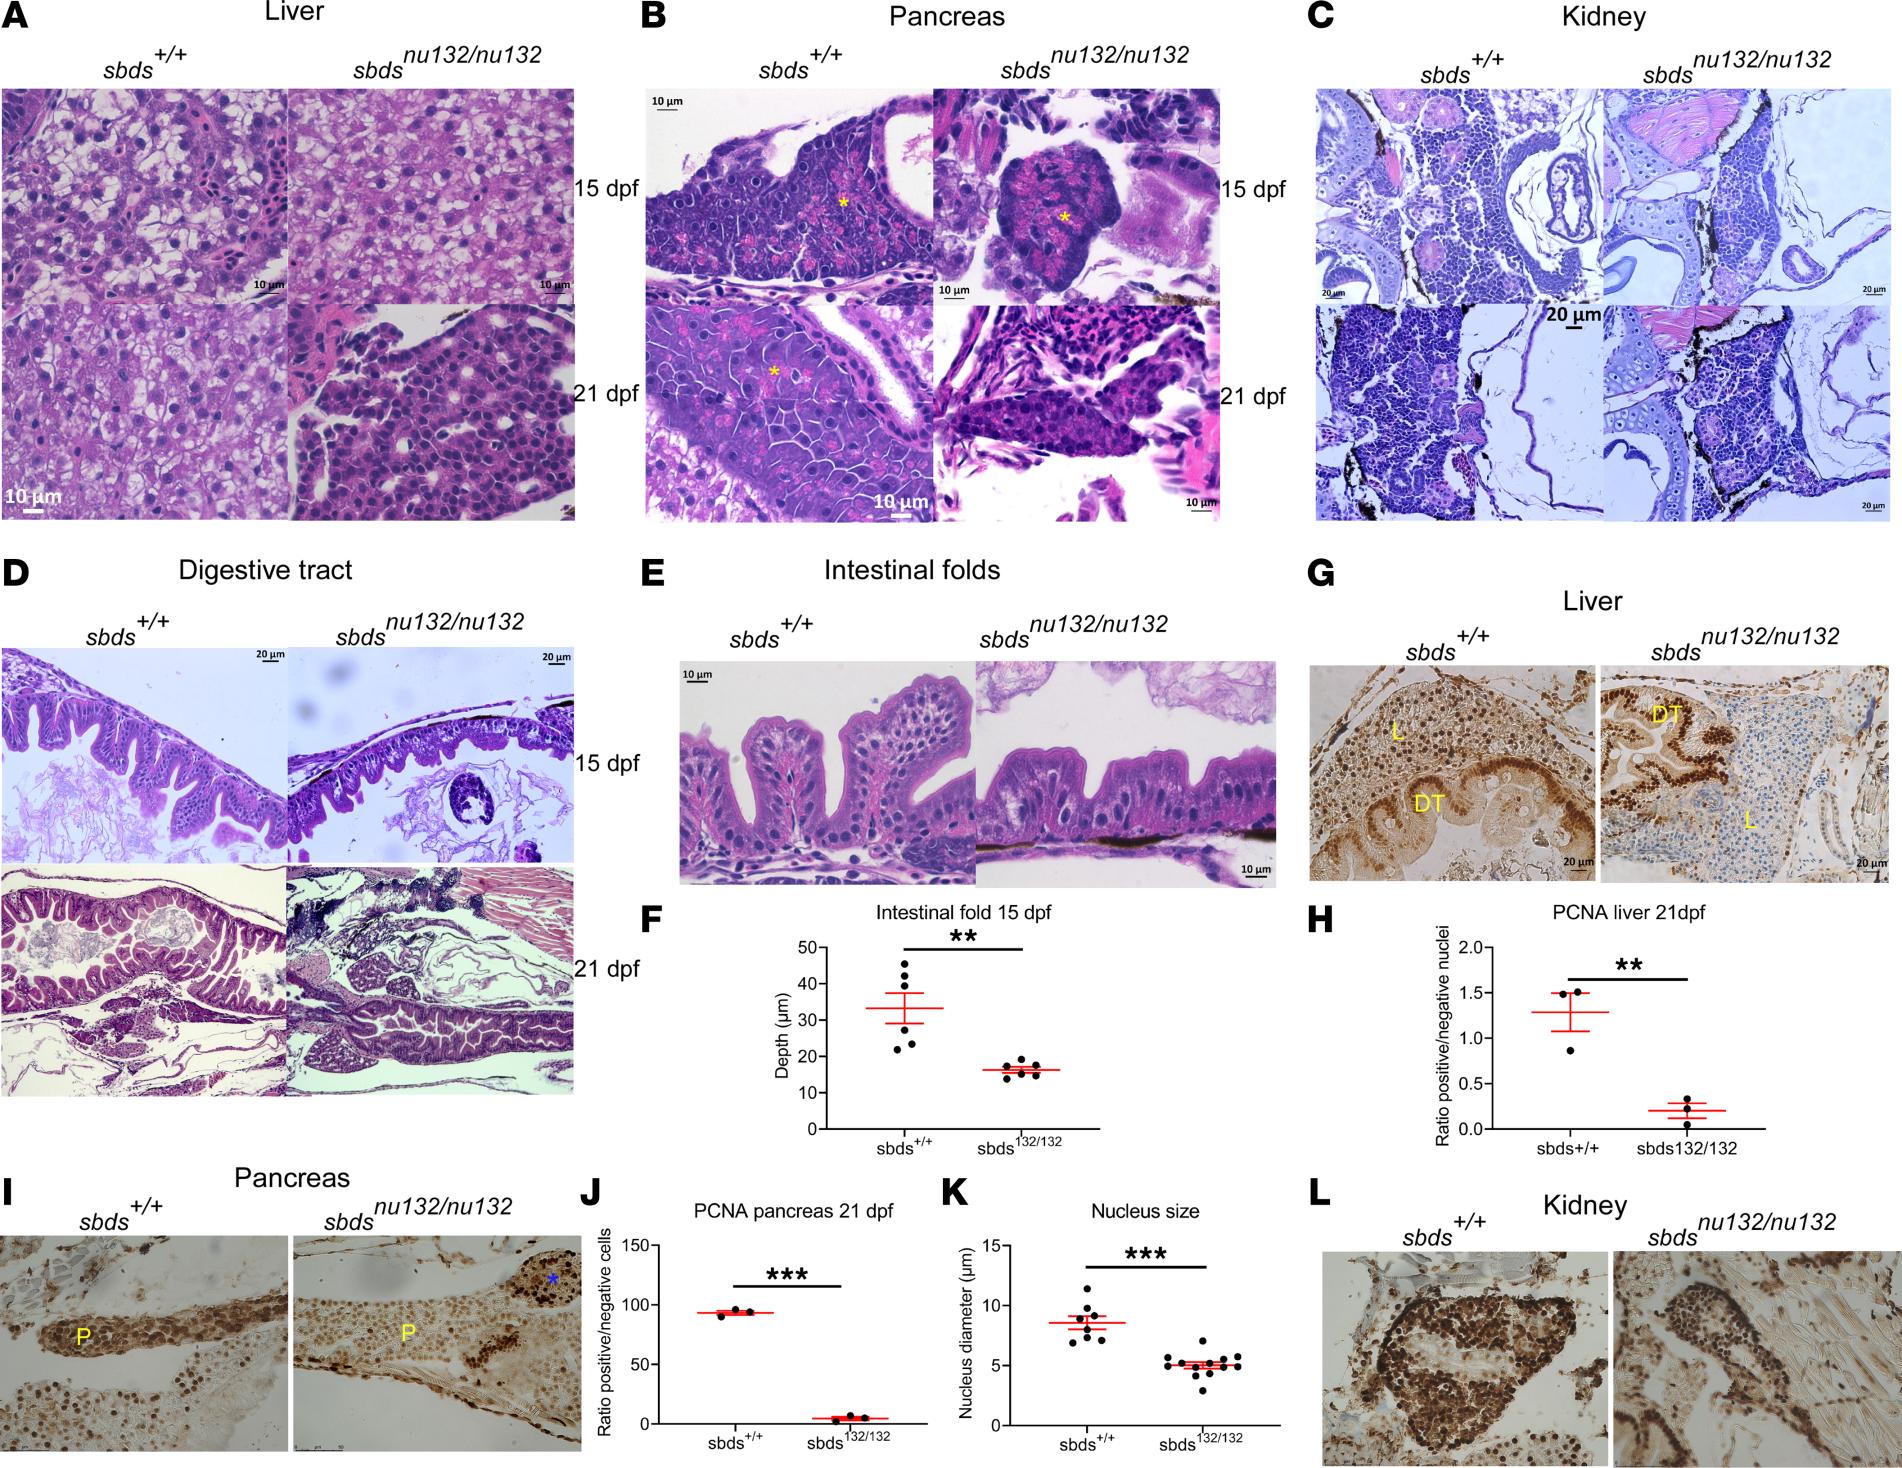
Fig. 3 H&E staining of (A) liver, showing no differences between sbds+/+ and sbdsnu132/nu132 at 15 dpf and liver fibrosis in sbds mutants at 21 dpf (original magnification, ×40); (B) pancreas, showing reduction of zymogen granules (yellow stars) (original magnification, ×40); (C) kidney and (D) digestive tract, showing a reduction in folds’ depth at 15 dpf and a constriction at 21 dpf in sbds mutants (original magnification, ×20); (E) intestinal folds at higher magnification (original magnification, ×40); and (F) quantitative differences in the depths of the epithelial folds. Immunohistochemistry for proliferation using PCNA in (G) liver at 21 dpf; (H) ratio of PCNA+ nuclei to total nuclei in the liver; (I) immunohistochemistry of pancreas, with blue star denoting the islet, at 21 dpf; and (J) ratio of PCNA+ nuclei to total nuclei in the pancreas and (K) kidney; no differences were detected in the ratios of positive nuclei to total nuclei (data not shown). (L) Quantification of the nucleus size in pancreatic acinar cells of sbds mutants versus WT siblings. *P < 0.05, **P < 0.001, ***P < 0.0001, t test. DT, digestive tract; L, liver; P, pancreas.