
|
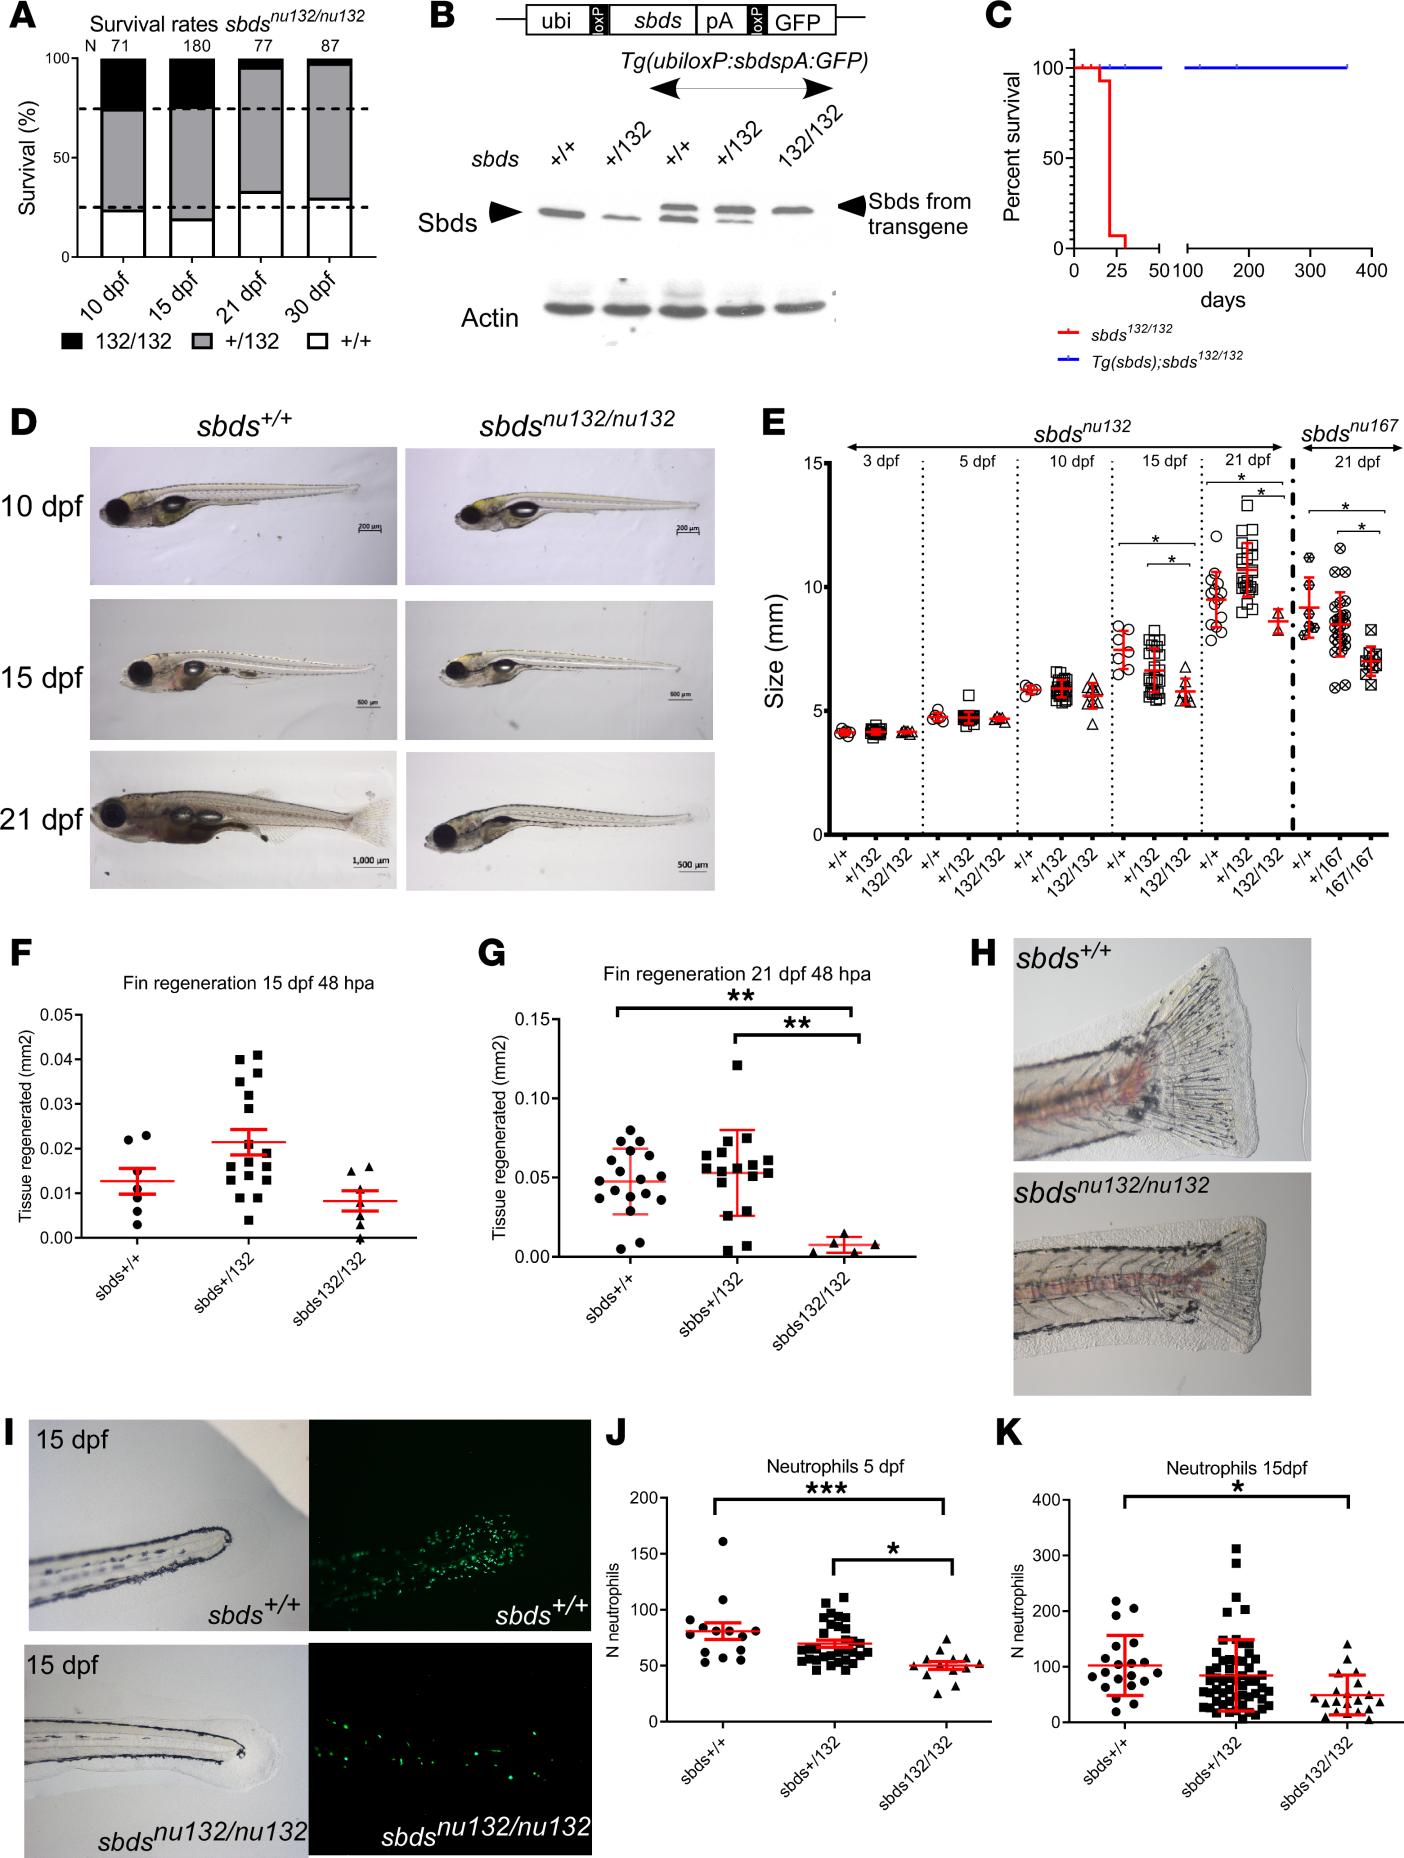
Fig. 2 (A) Survival rates for siblings of sbdsnu132. (B) Rescue of sbds mutants: Western blot showing Sbds from fins of adult fish with the indicated different genotypes. Note that the transgenic line expresses Sbds of a slightly bigger mass, due to an inadvertently introduced initiation codon upstream of the coding sequence. We took advantage of this 23–amino acid tag to distinguish between endogenous and exogenously introduced Sbds. Actin is shown as a control for protein loading. (C) Survival analysis, which demonstrates the rescue of sbdsnu132/nu132 by the transgenic line Tg(ubiloxP:sbdsloxP:GFP) N = 50; sbdsnu132/nu132. (D) Images of 10, 15, and 21 dpf larvae from the same clutch: sbds+/+ and sbdsnu132/nu132. Scale bars: 200 μm (10 dpf), 500 μm (15 dpf), 1000 μm (sbds+/+ 21 dpf), and 500 μm (sbdsnu132/nu132 21 dpf). (E) Size variability of mutants (sbdsnu132 and sbdsnu167) in the first 21 dpf. Fin regeneration 48 hours after amputation (hpa) in fish that are (F) 15 dpf (N = 30) and (G) 21 dpf, which shows less regeneration (N = 42). (H) Representative images of the fins 48 hpa in 21 dpf larvae for sbds+/+ and sbdsnu132/nu132. The sbdsnu132/nu132 mutants possess a decreased number of neutrophils. Original magnification, ×6.3. (I) Presence of neutrophils at 15 dpf in sbds+/+ and sbdsnu132/nu132 using the Tg(mpx:Dendra2)uw4. Original magnification, ×20. Number of neutrophils (J) at 5 and (K) at 15 dpf; N = 59 and N = 96, respectively. ANOVA test. *P < 0.05, **P < 0.001, ***P < 0.0001.