
|
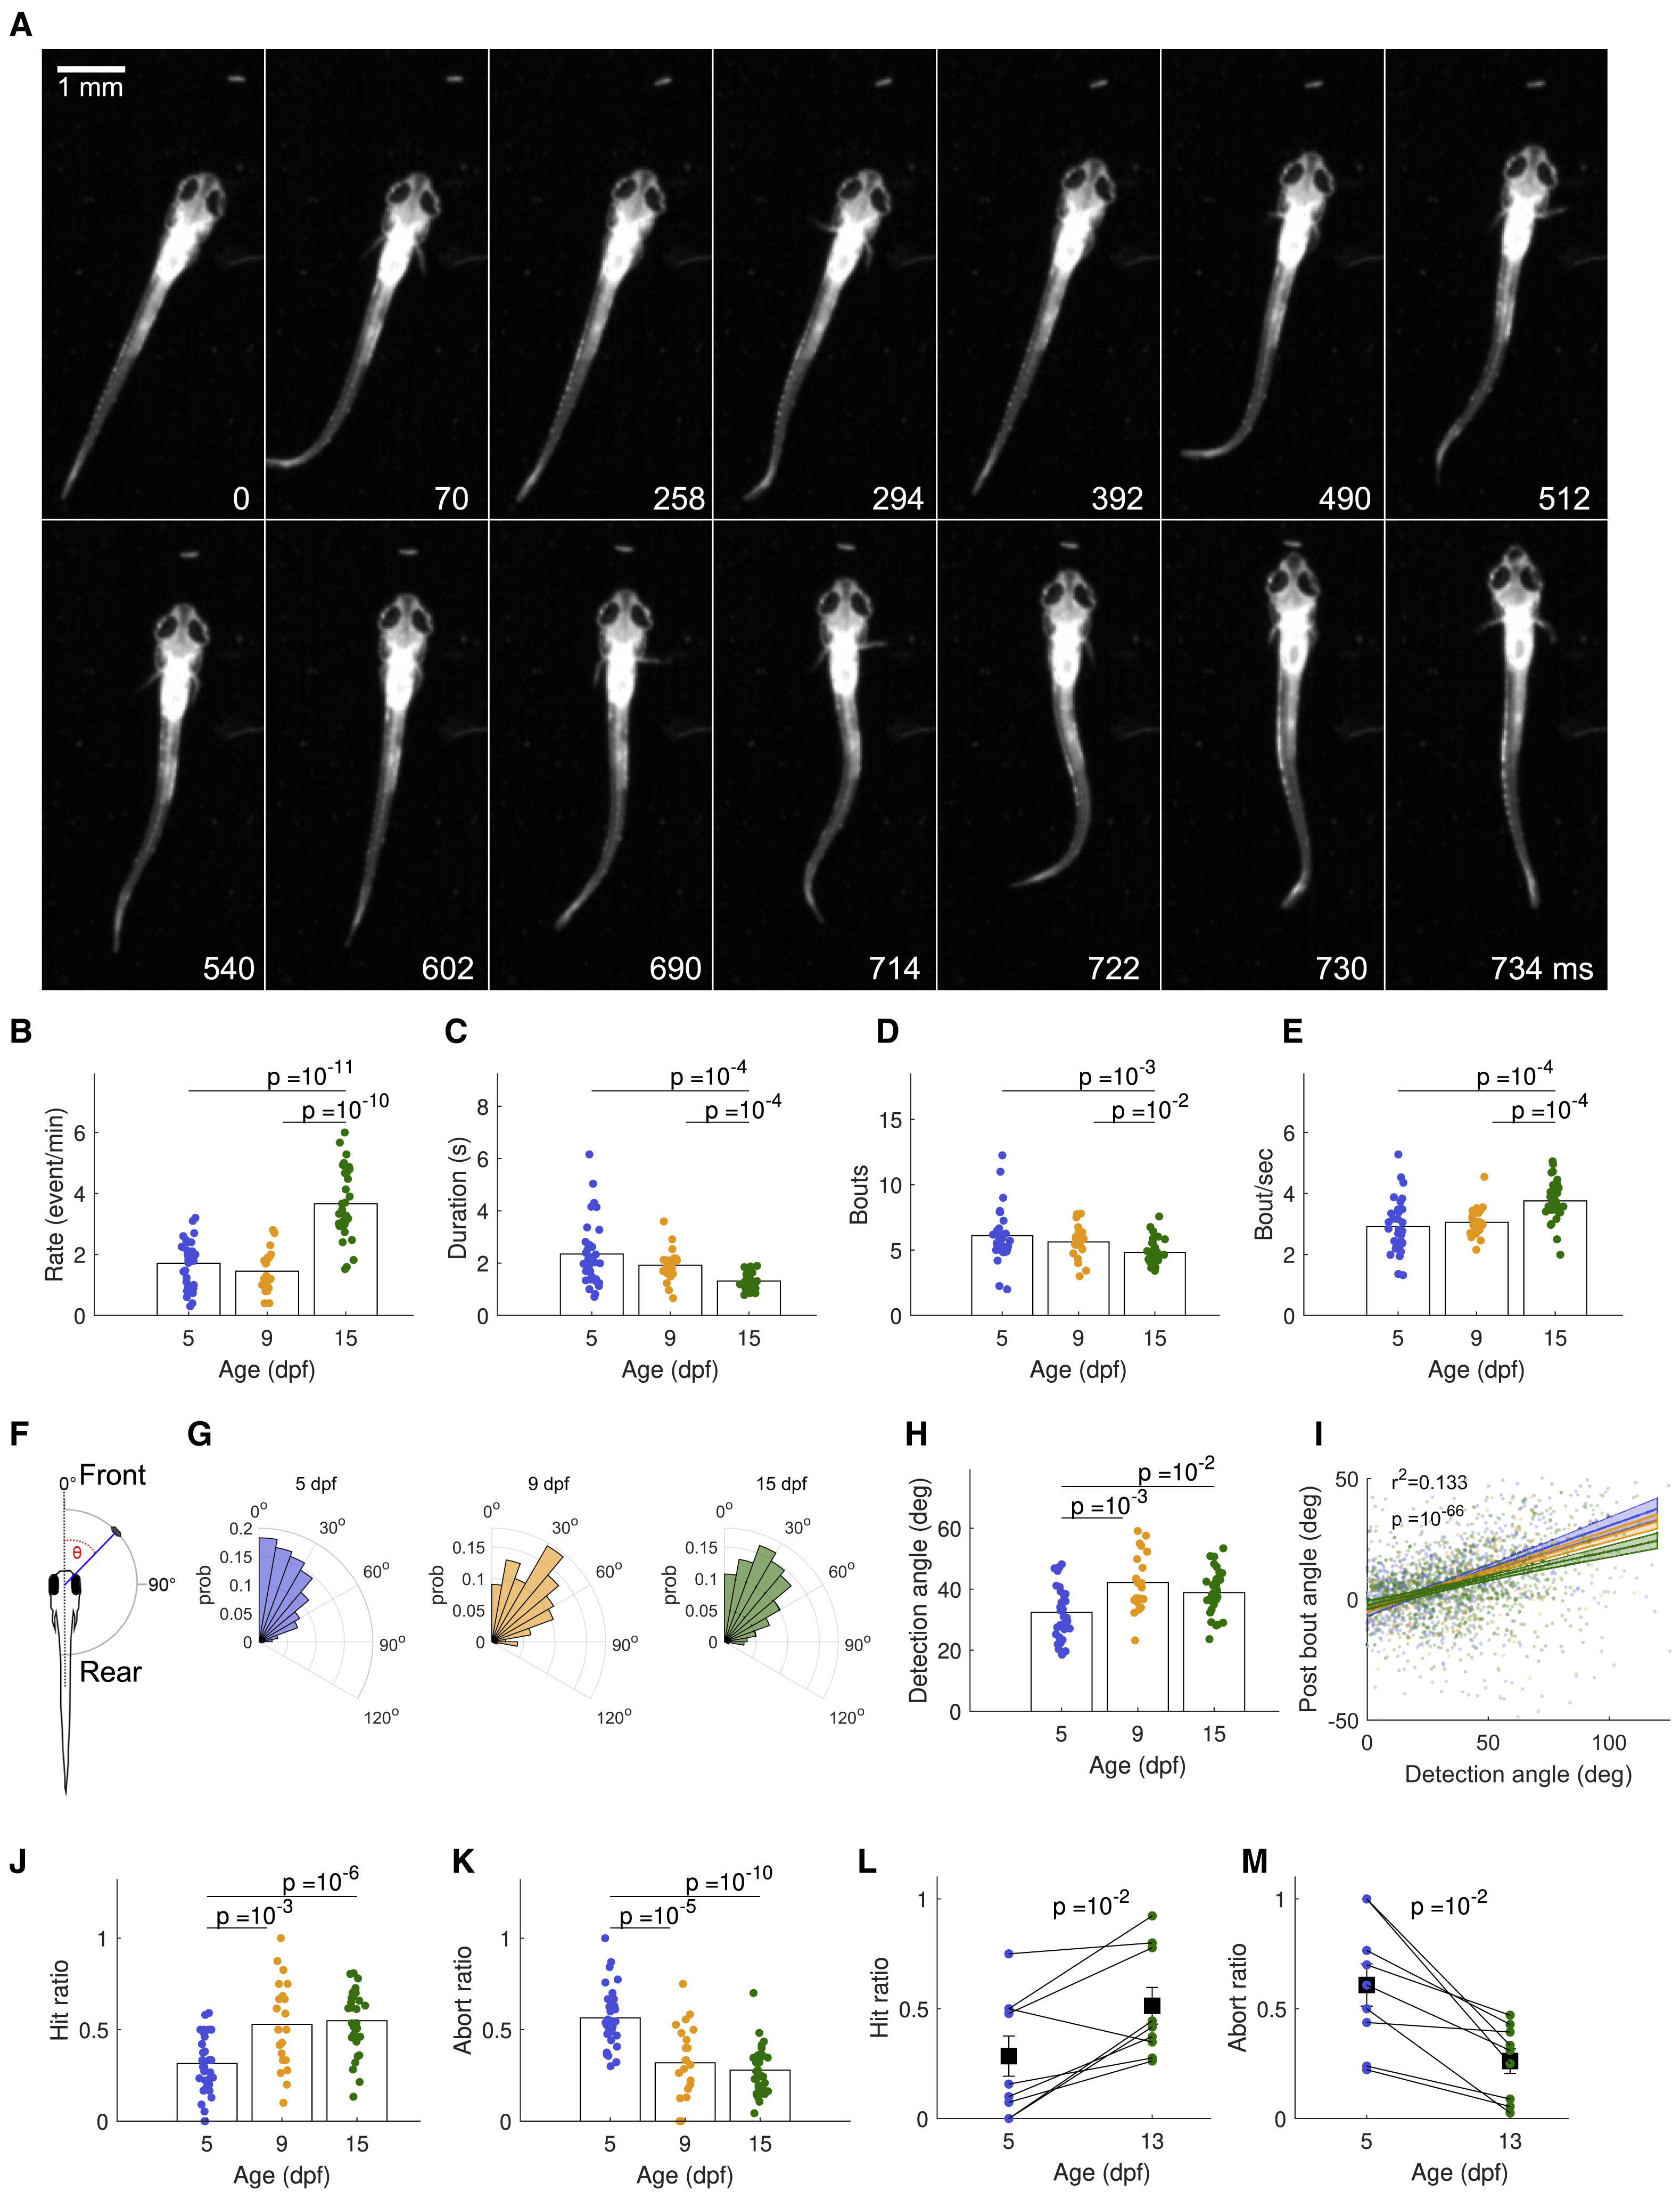
Fig. 1 (A) A sequence of frames during a hunting event from the moment of prey detection (0 ms), showing orientation and eye convergence (70 ms), approach (294, 512 ms), strike (714–730 ms), and prey capture (734 ms). (B) Hunting event rate is higher for 15-dpf than for 5- and 9-dpf fish(t test) (C) Hunting events become shorter over development (Wilcoxon rank-sum). (D) Number of bouts per event is lower for 15-dpf than for 9- and 5-dpf fish (Wilcoxon rank-sum).. (E) Bout rate is higher at 15 dpf than at 5 and 9 dpf (t test). (F) Detection angle is defined as the angle between a Paramecium and the midline of the fish just prior to eye convergence. (G) Distributions of prey detection angle for 5-, 9-, and 15-dpf fish change over development (5 versus 9, ; 5 versus 15, ; 9 versus 15, ; two-sample Kolmogorov-Smirnov test). (H) 9- and 15-dpf fish detect Paramecia at larger angles (i.e., toward the rear visual field) than do 5-dpf fish. (I) The relation between prey detection angle and angle to prey after the first bout (here, each point represents a bout rather than a fish). Multiple regression analysis (see STAR Methods) reveals a positive correlation between detection angle and post-bout angle, indicating that the fish undershoot the turn (coefficient ; ) and that the degree of undershoot reduces with age (coefficient ; ). Turn angle does not change with age independently of prey angle (; ). Solid lines show the fitted regression model for each age. Shaded regions show the 95% confidence intervals for each slope. statistic and p value shown are for the overall model. For clarity, the small number of turns falling outside the range between −50 and 50 degrees are not plotted. (J) Hunting performance, as measured by the proportion of all hunting events per fish which are successful, increases over development (t test). (K) Abort ratio decreases over development (t test). (L) Hunting performance of individuals imaged at both 5 and later at 13 dpf increases over development (paired-sample t test). Black squares represent the mean; bars, SEMs. (M) Abort ratio of individuals imaged at both 5 and later at 13 dpf decreases over development (paired-sample t test). Black squares represent the mean; bars, SEMs.